

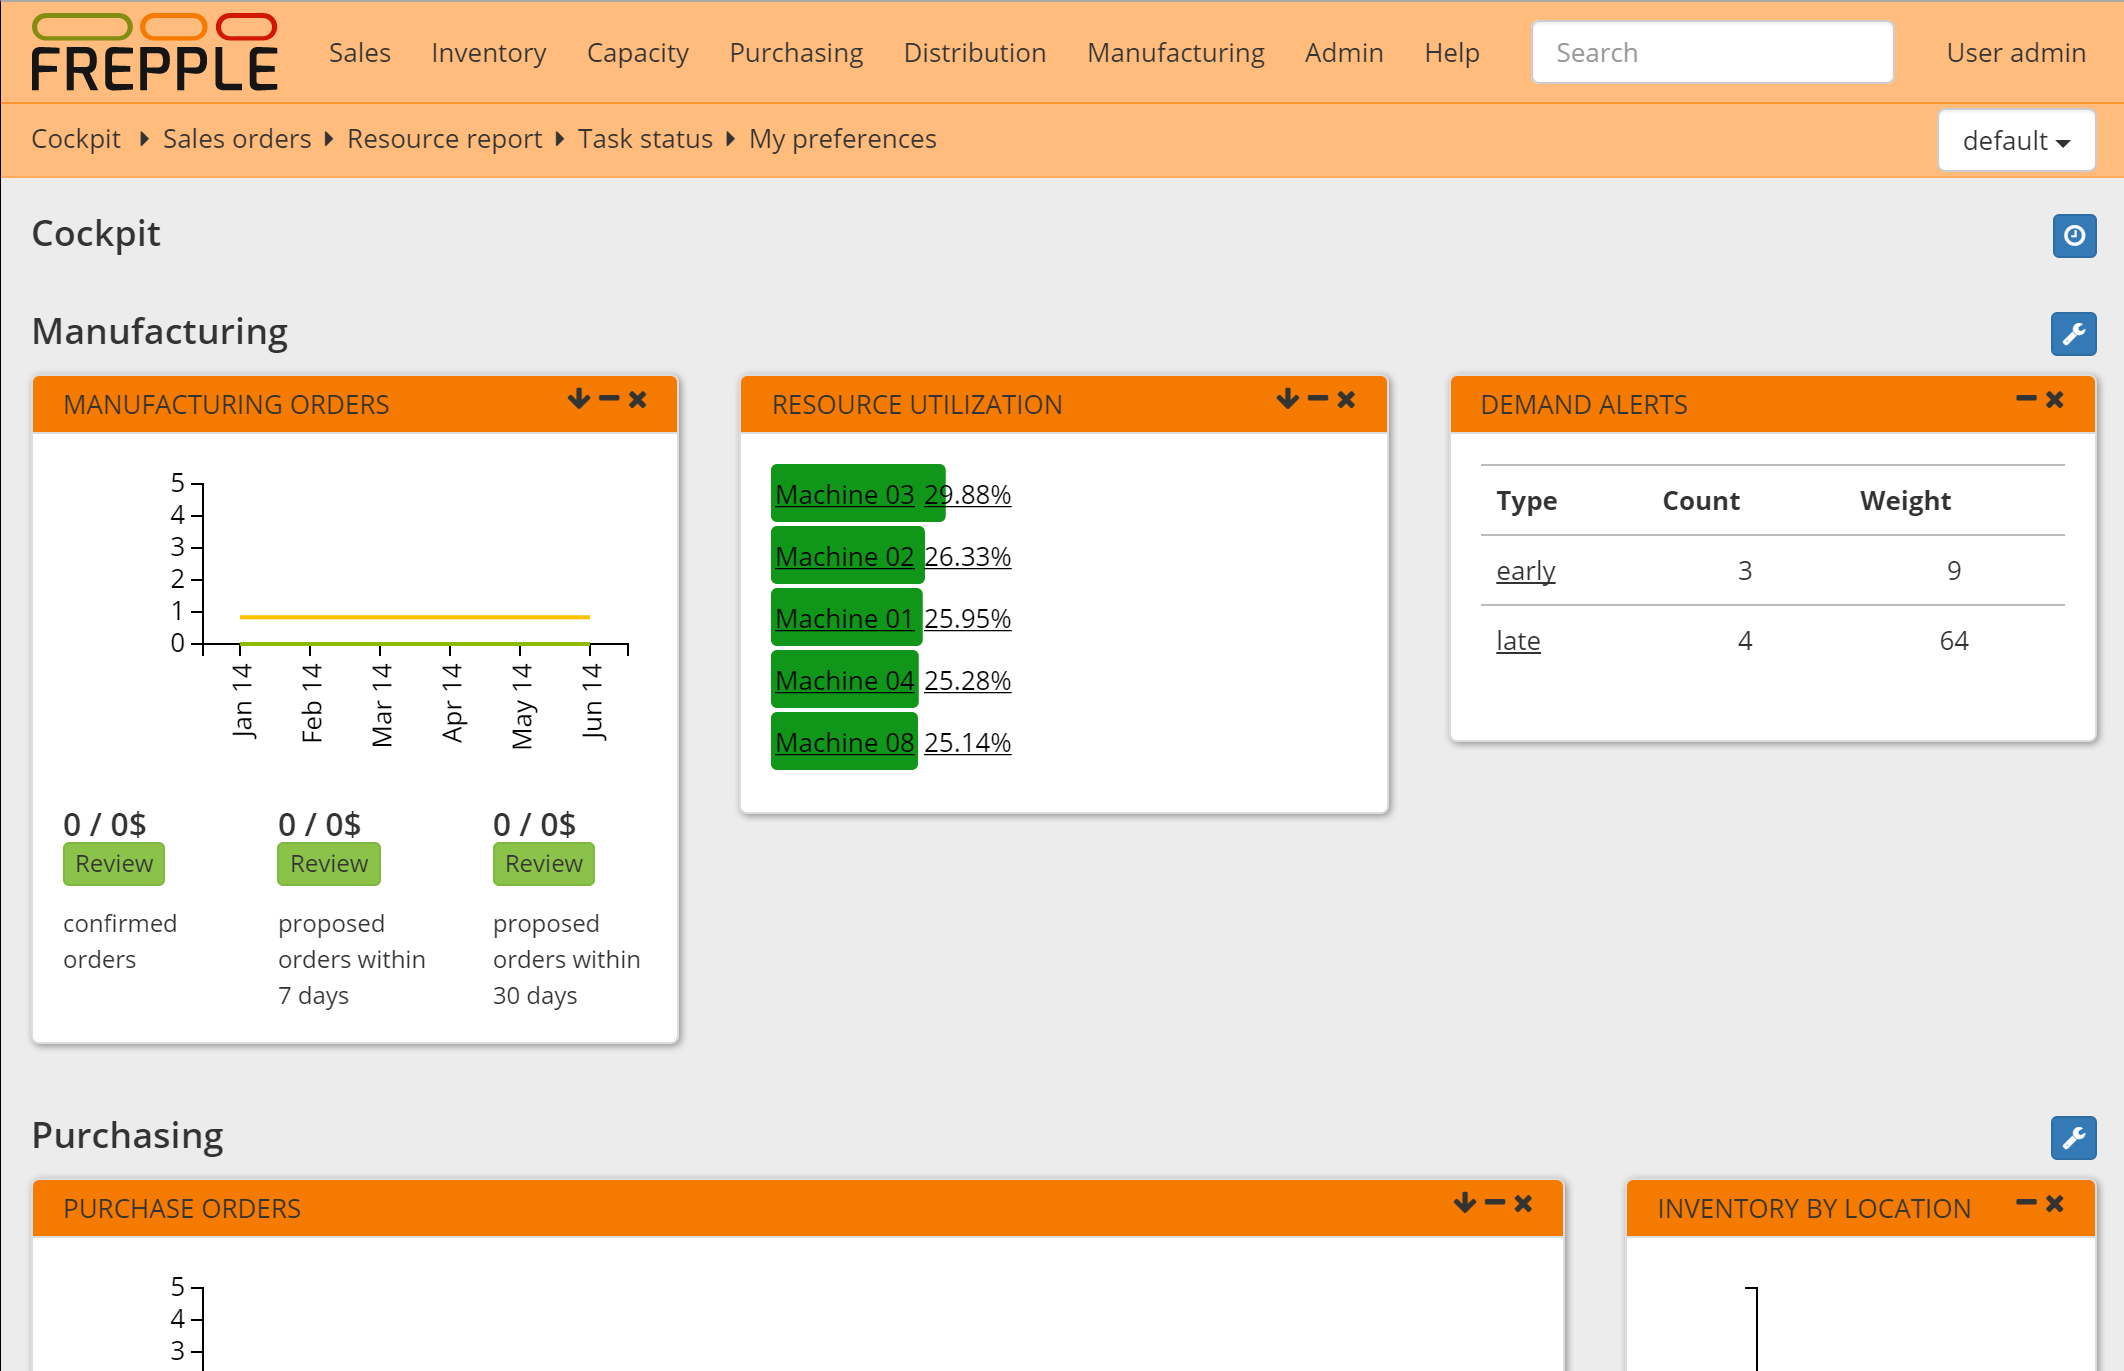
Cockpit
The cockpit is the home page of the application. Structured as a dashboard it provides a number of widgets that a planner uses in his daily planning activities. It is an efficient starting point for the common activities.
The cockpit is configurable to meet the requirements and taste of your implementation. Customized widgets are also easy develop. In the Community Edition all users will see the same dashboard. In the Enterprise Edition every user gets his own dashboard, which he can customize interactively.
Available widgets
The following widgets are currently available:
- Purchase ordersProvides a high level overview of the open purchase orders, and new orders that will need to be created soon.
- Purchase queueDisplays a list of new purchase orders that should be placed on your suppliers.
- Distribution ordersProvides a high level overview of the open distribution orders, and new orders that will need to be created soon.
- Distribution queueDisplays a list of new distribution orders that should be placed.
- Manufacturing ordersProvides a high level overview of the open manufacturing orders, and new orders that will need to be created soon.
- Resource queueThis is the list of operations that are about to be started on each resource.
- Shipping queueDisplays a list of customer orders that are about to be shipped.
- Welcome widgetA welcome text to give first-time users some guidance to get started with the application.
- NewsThis widget picks up the latest news topics from frepple.com.
- Recent actionsShows your most recent editing actions.
- Generate planRegenerates a constrained plan.
- AlertsShows a summary of the exceptions and problem areas.
- Late ordersShows the most urgent orders that are planned late.
- Short ordersShows the most urgent orders that are unplanned or incompletely planned.
- Purchase order analysisShows the urgency of the existing (locked) purchase orders.
- Resource utilizationDisplays the resources with the highest utilization.
- Delivery performanceThis widget shows the percentage of order lines that are planned to be shipped on time.
- Inventory by locationThis widget shows the locations carrying the most inventory.
- Inventory by itemThis widget shows the items which take up the most inventory value.
- Inventory analysisDisplay an analysis of which item-locations have stockout risks.Depending on the stockout risk, a red/yellow/green color code is assigned.The widget shows the number of item-locations in each color code by location.
- Forecast errorDisplay the Symmetric Mean Percentage Error (aka SMAPE). The result is aggregated across all forecast per bucket, weighted by the forecast quantity.The widget is only available in the Enterprise Edition and when the forecasting module is enabled.
Configuring the cockpit
In the Community Edition the same dashboard is configured for all users. Administrators can configure it in the file djangosettings.py.
In the Enterprise Edition every user can easily customize the dashboard with the widgets that are most relevant for his/her daily work.