Demand Gantt report
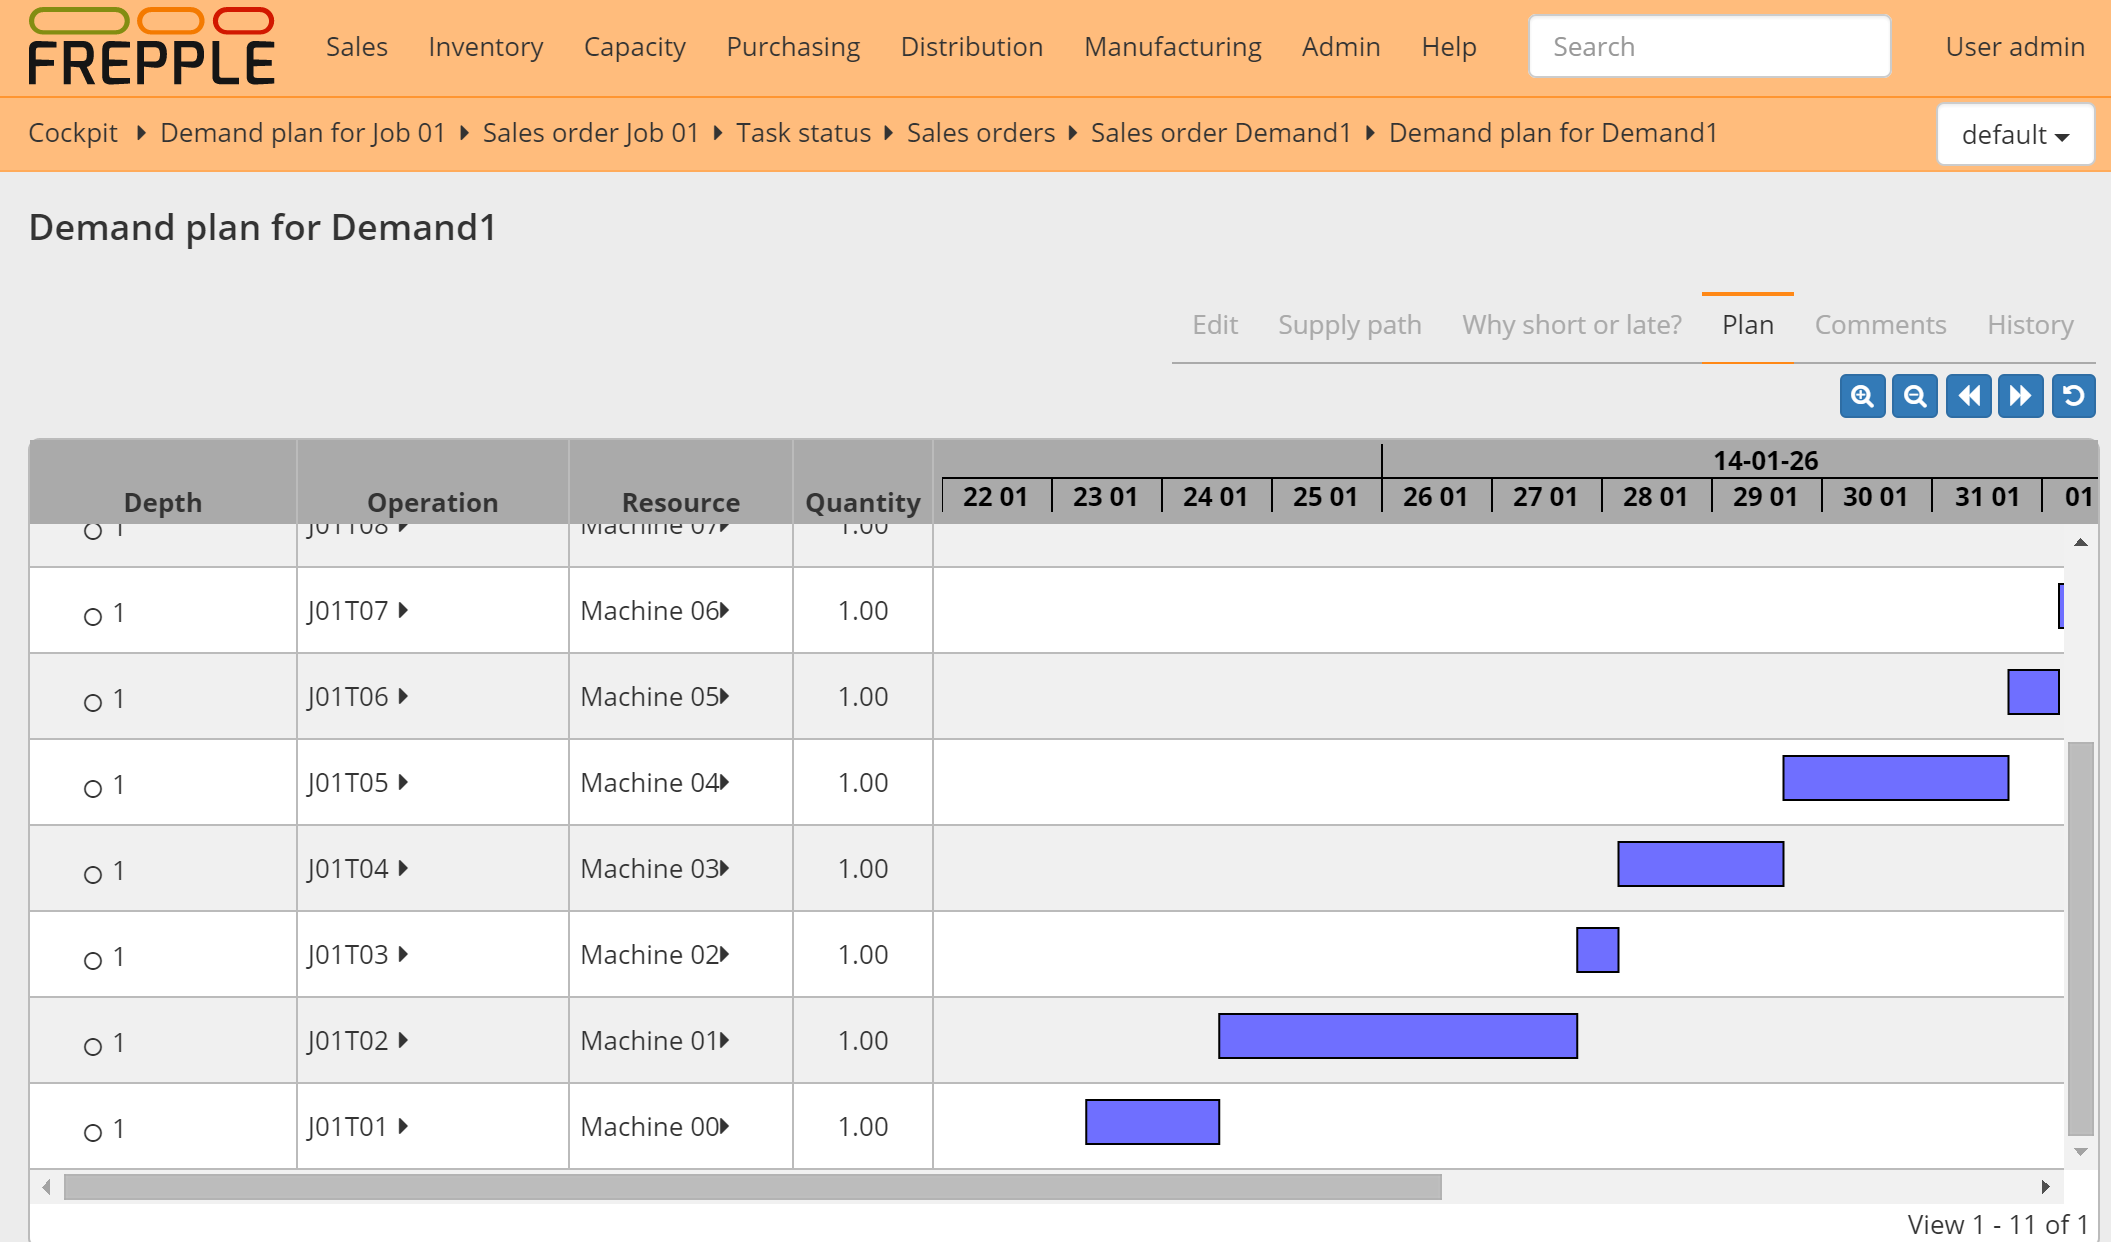
This report shows a graphical representation of the complete plan of a certain demand. The plan show all planned activities from raw material, manufacturing operations, up to the deliveries to the customer. In the Gantt chart the current date is marked as a black line, and the due date of the demand is marked as a red line.
Field |
Description |
|---|---|
Depth |
Depth of this operation in the supply path: 0 = delivery, 1 = operation right before the delivery, … N = raw material purchase operation |
Operation |
Operation being planned. |
Resource |
Resource(s) being loaded by this operationplan. |
Quantity |
Quantity of the operationplans pegged to the demand.
In the Gantt chart the operationplans are shown in detail. Some of the
operationplans may be only partly allocated to the demand being displayed.
|