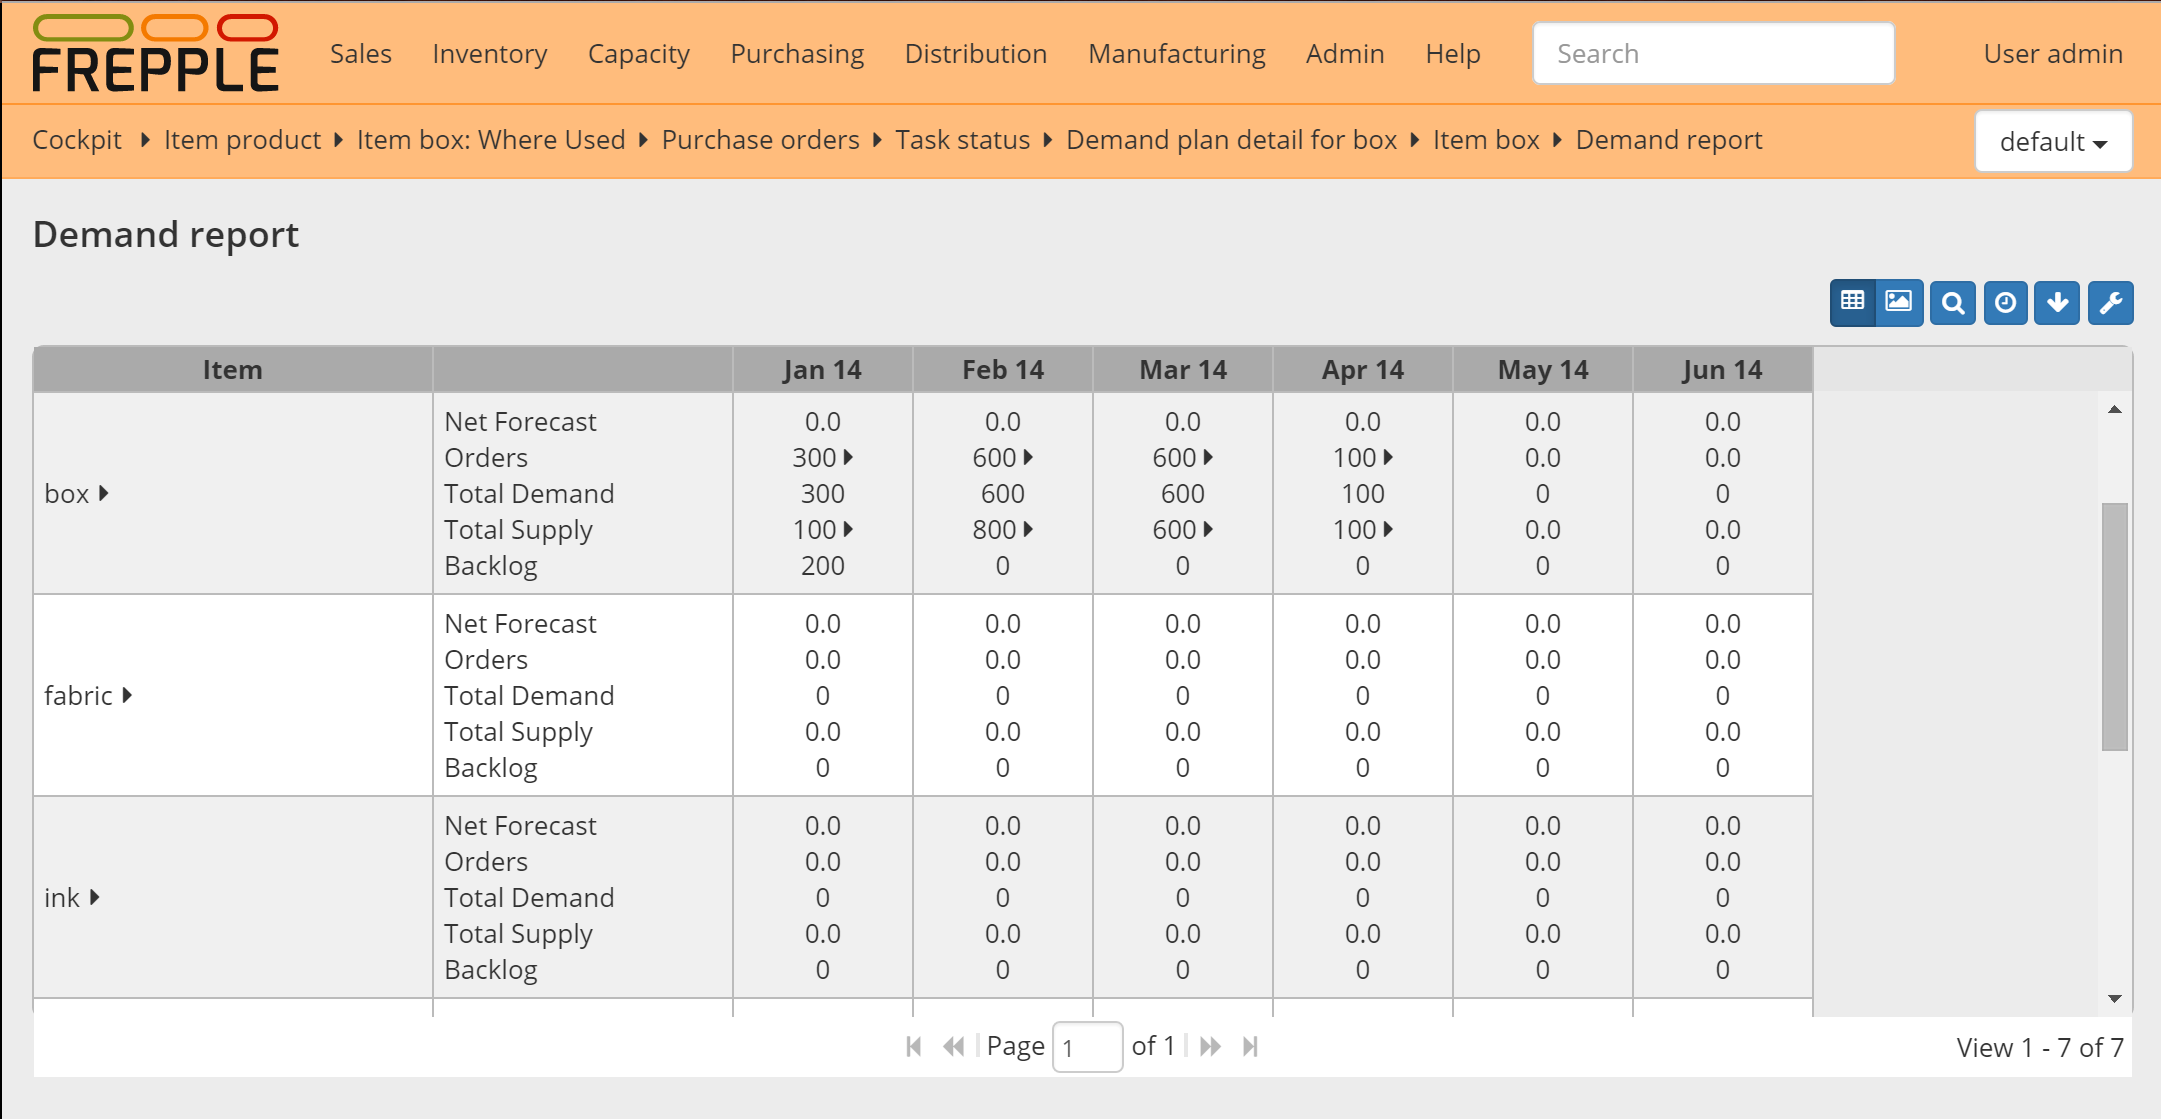
Demand report
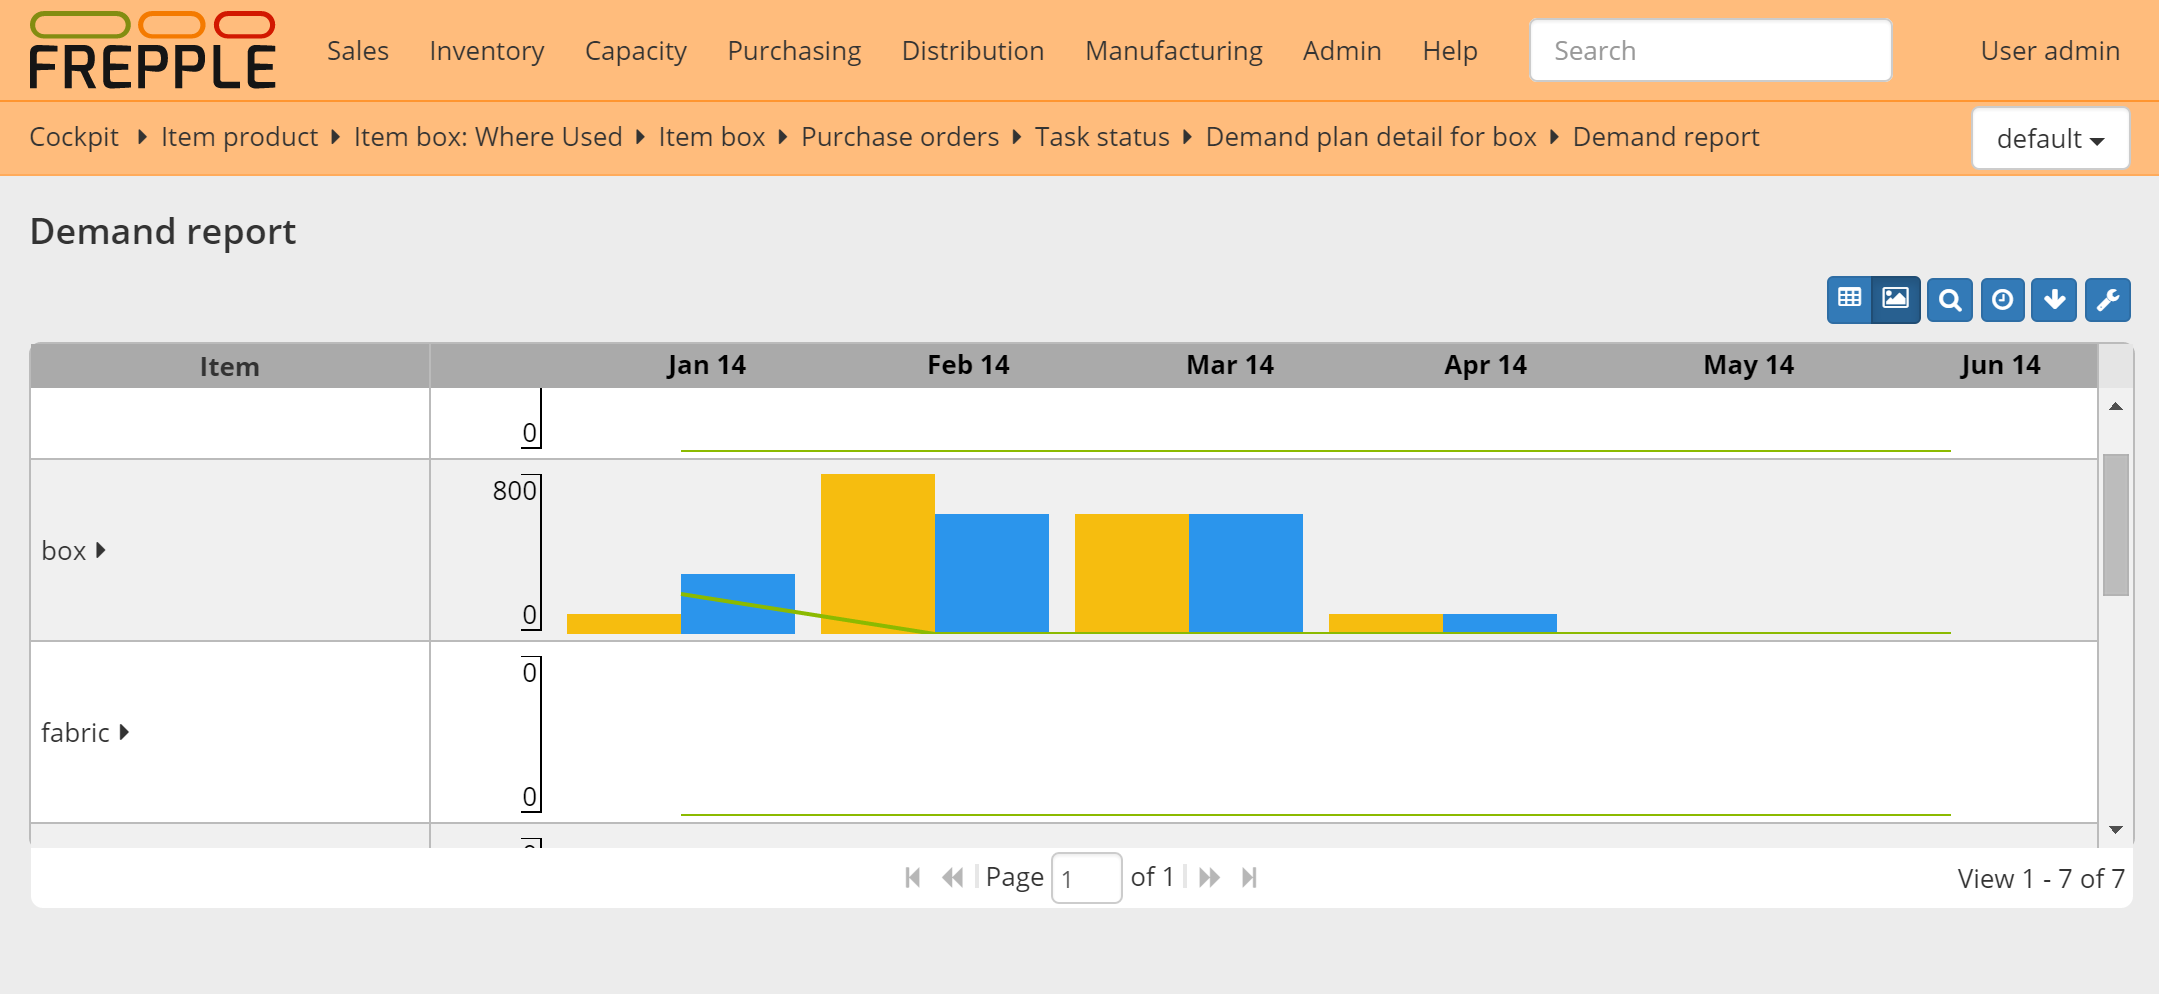
This report shows per item and per time bucket the demand quantity, the supplied quantity and the backlog.
A drilldown report is also available to show the detailed data as a list.
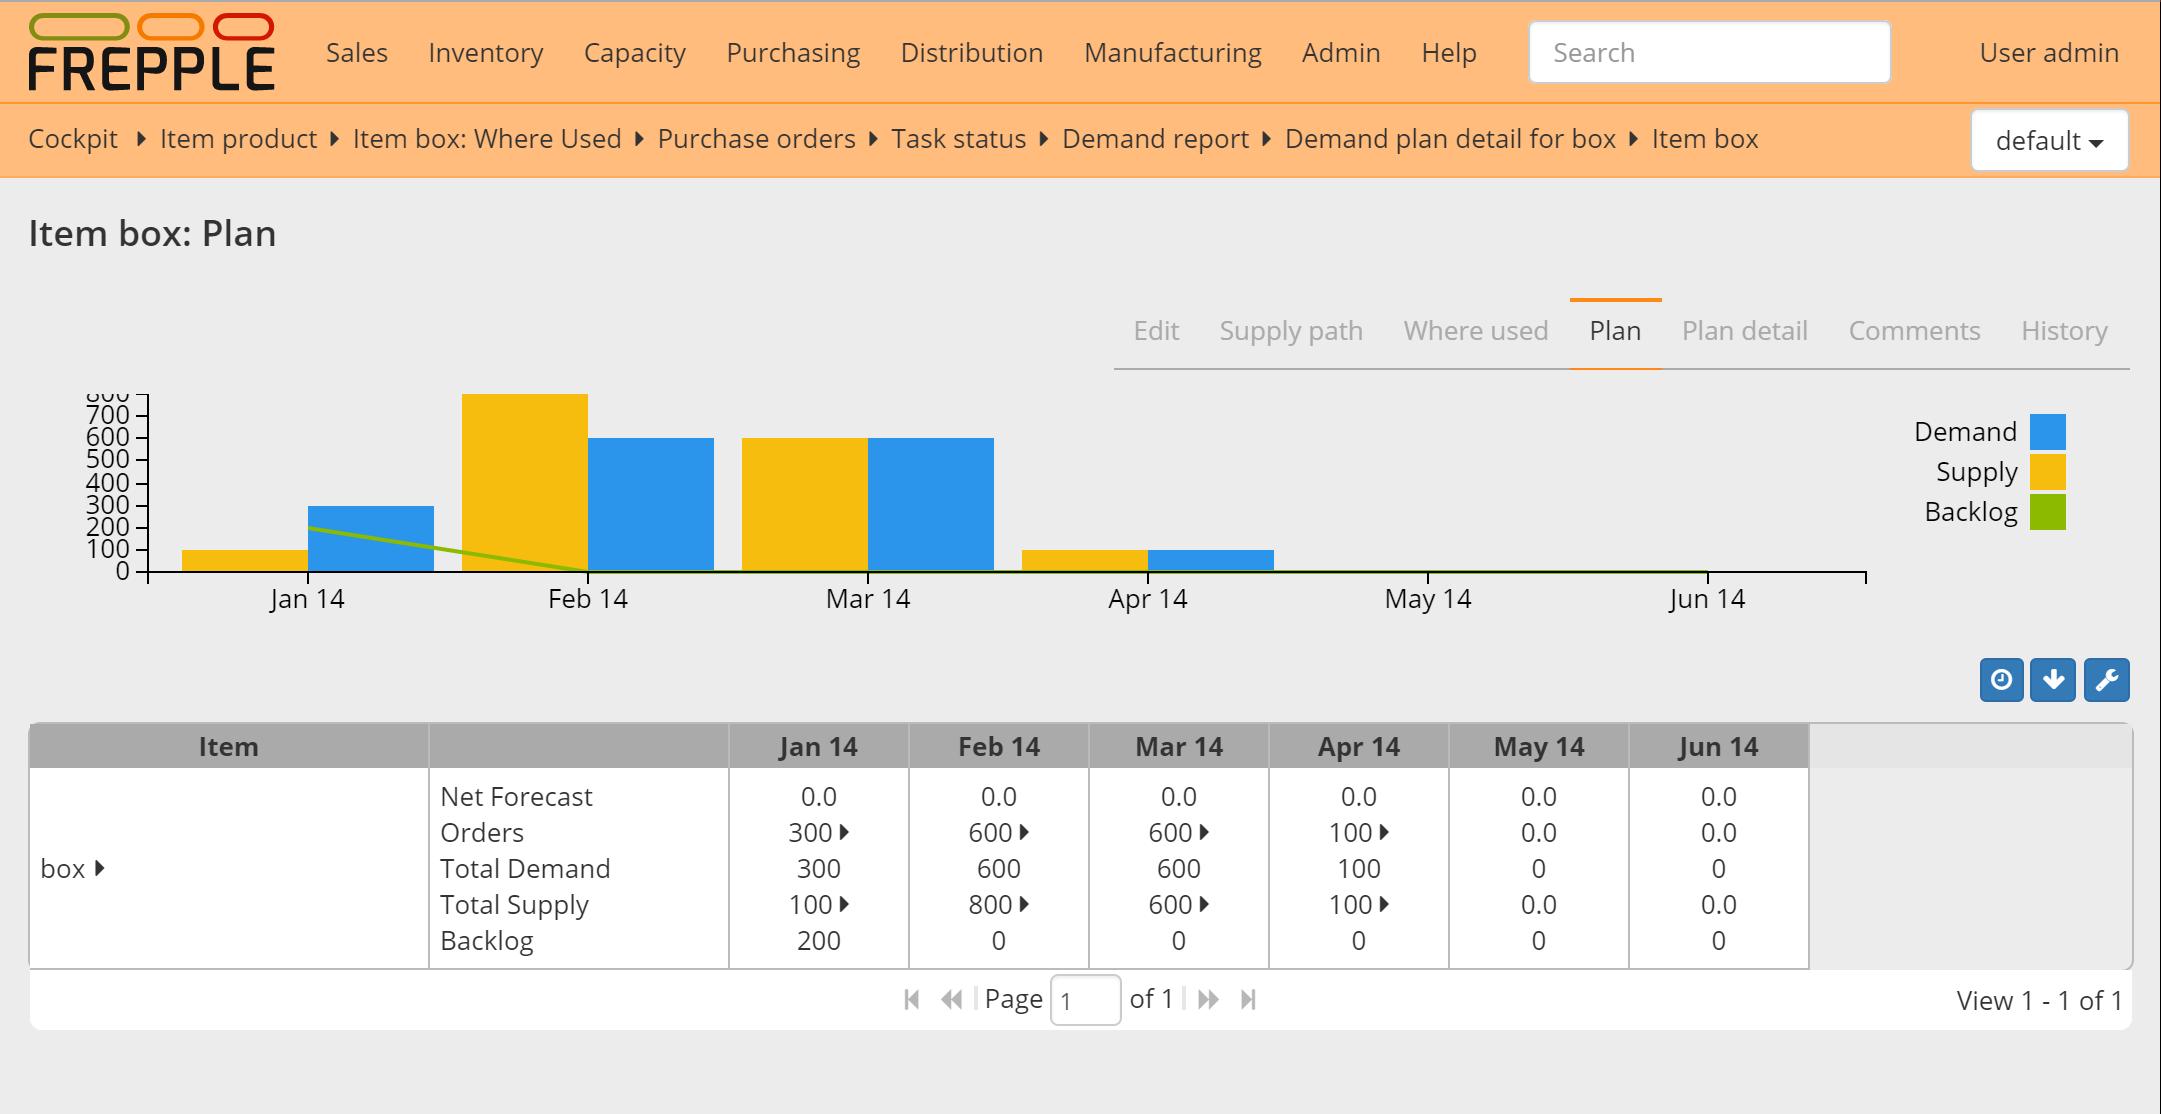
If the report is opened for a single item a graph is displayed.
Given the row definitions, the following equations apply:
total demand = net forecast + orders
backlog = backlog of previous bucket + total demand – total supply
Field |
Description |
|---|---|
Item |
Item name. |
Net forecast |
Amount of net forecast in the time bucket (only in Enterprise edition). |
Orders |
Amount of customer orders (only in Enterprise edition). |
Total demand |
Total demand for this item due in the time bucket. |
Total supply |
Satisfied deliveries for this item in the time bucket. |
Backlog |
Difference between the supply and demand, accumulated across time buckets. |