Manufacturing order summary
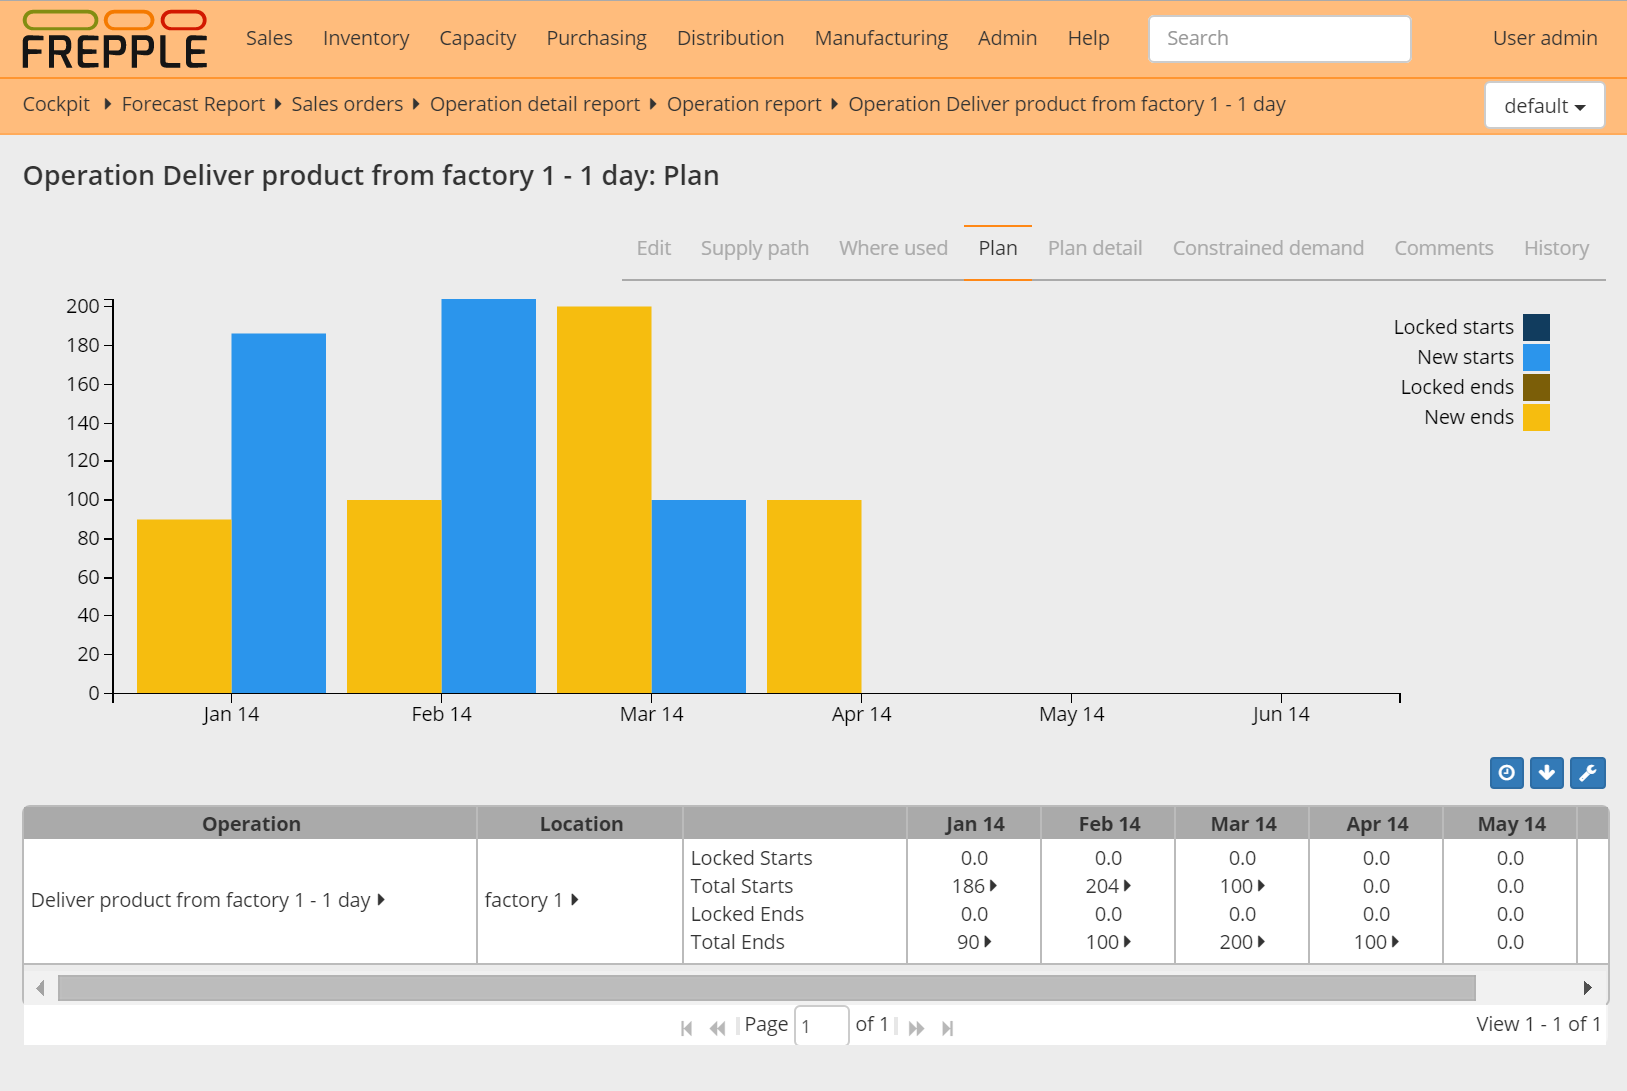
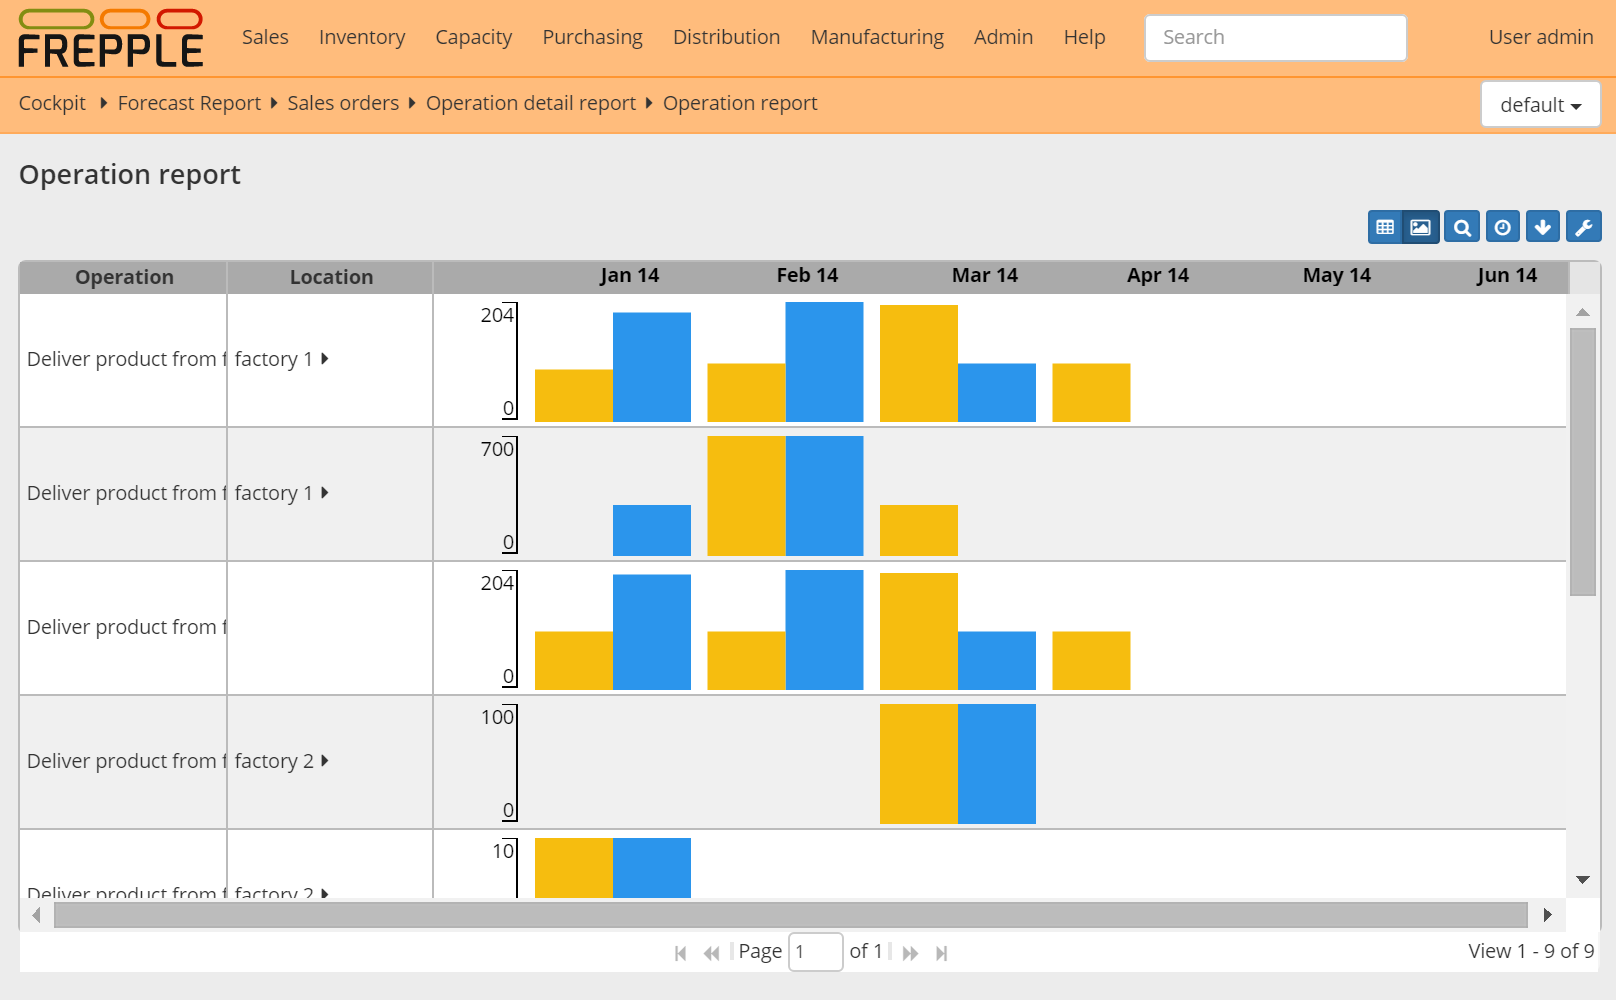
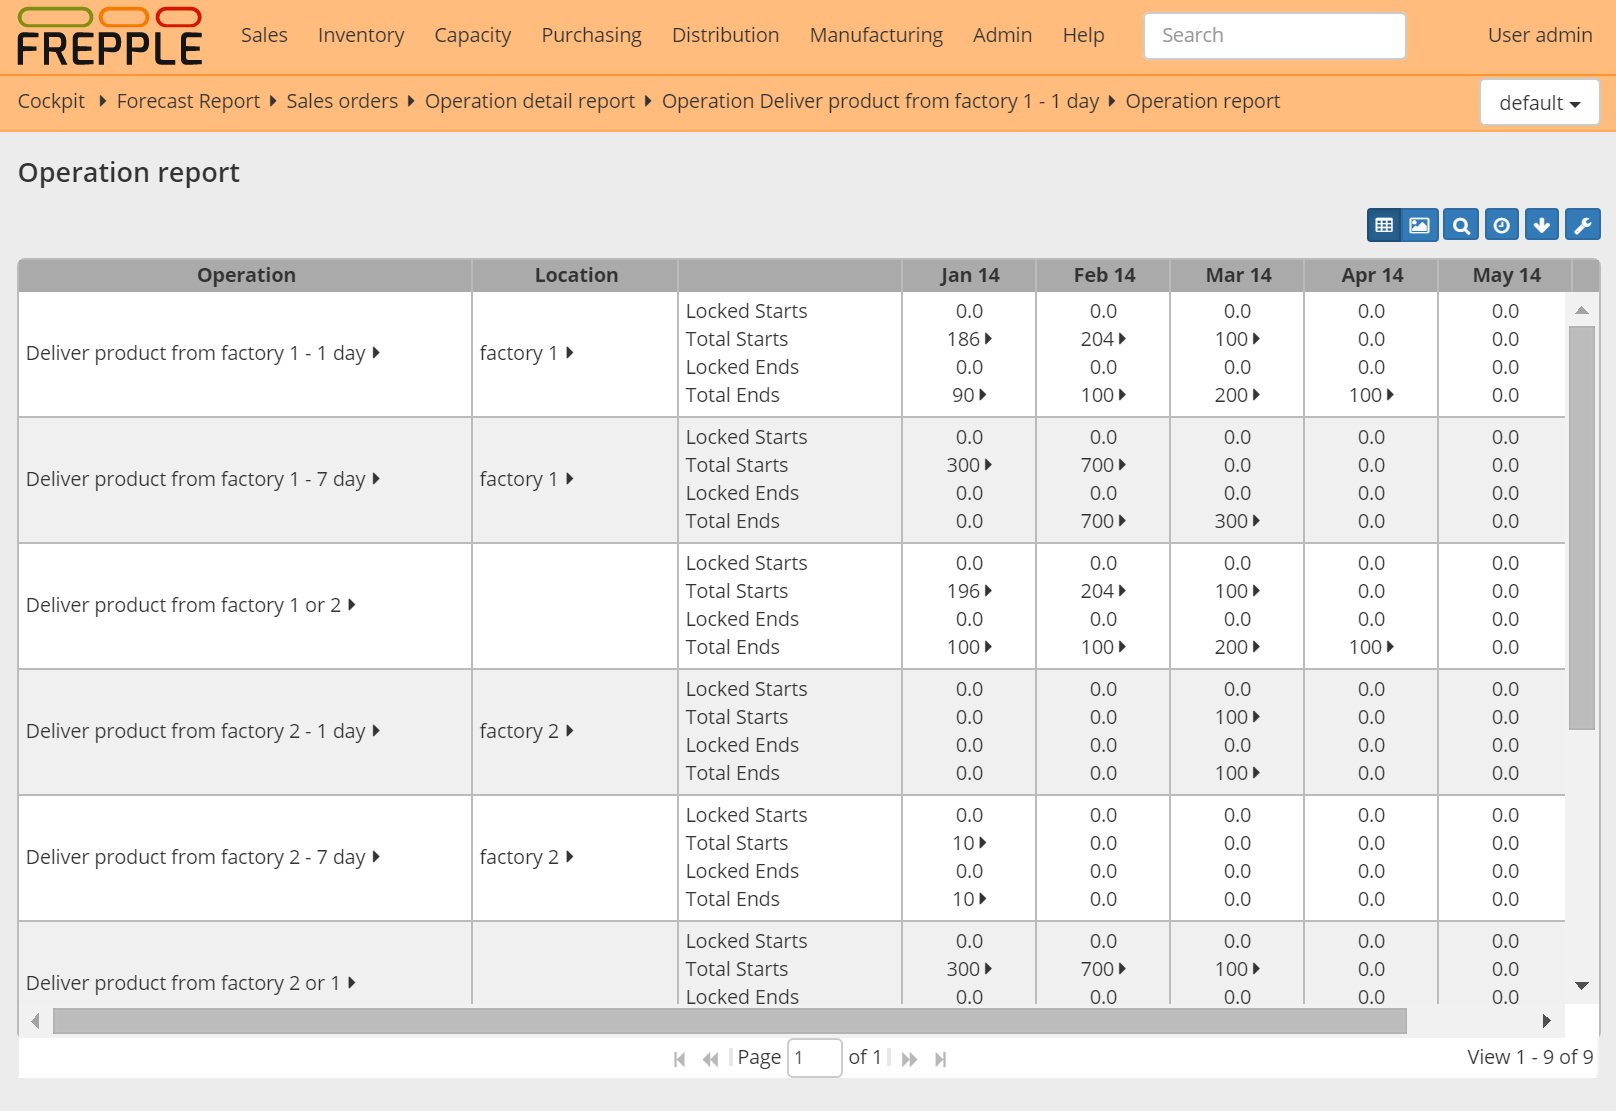
The report shows for each time bucket and each operation the quantity started and finished. A drilldown report is also available to show the detailed data as a list.
If the report is opened for a single operation a graph is displayed to visualize the results.
In earlier releases this screen was called “operation report”.
Field |
Description |
|---|---|
Operation |
Name of the operation. |
Location |
Location of the operation. |
Proposed starts |
Sum of the quantity of all proposed manufacturing orders starting in this time bucket. |
Total starts |
Sum of the quantity of all manufacturing orders starting in this time bucket. |
Proposed ends |
Sum of the quantity of all manufacturing orders ending in this time bucket. |
Total ends |
Sum of the quantity of all manufacturing orders starting in this time bucket. |
Proposed production |
Proposed production in this bucket, where the produced quantity is assumed to be evenly distributed between the start and end date of each manufacturing order. |
Total production |
Total production in this bucket, where the produced quantity is assumed to be evenly distributed between the start and end date of each manufacturing order. |