Inventory report
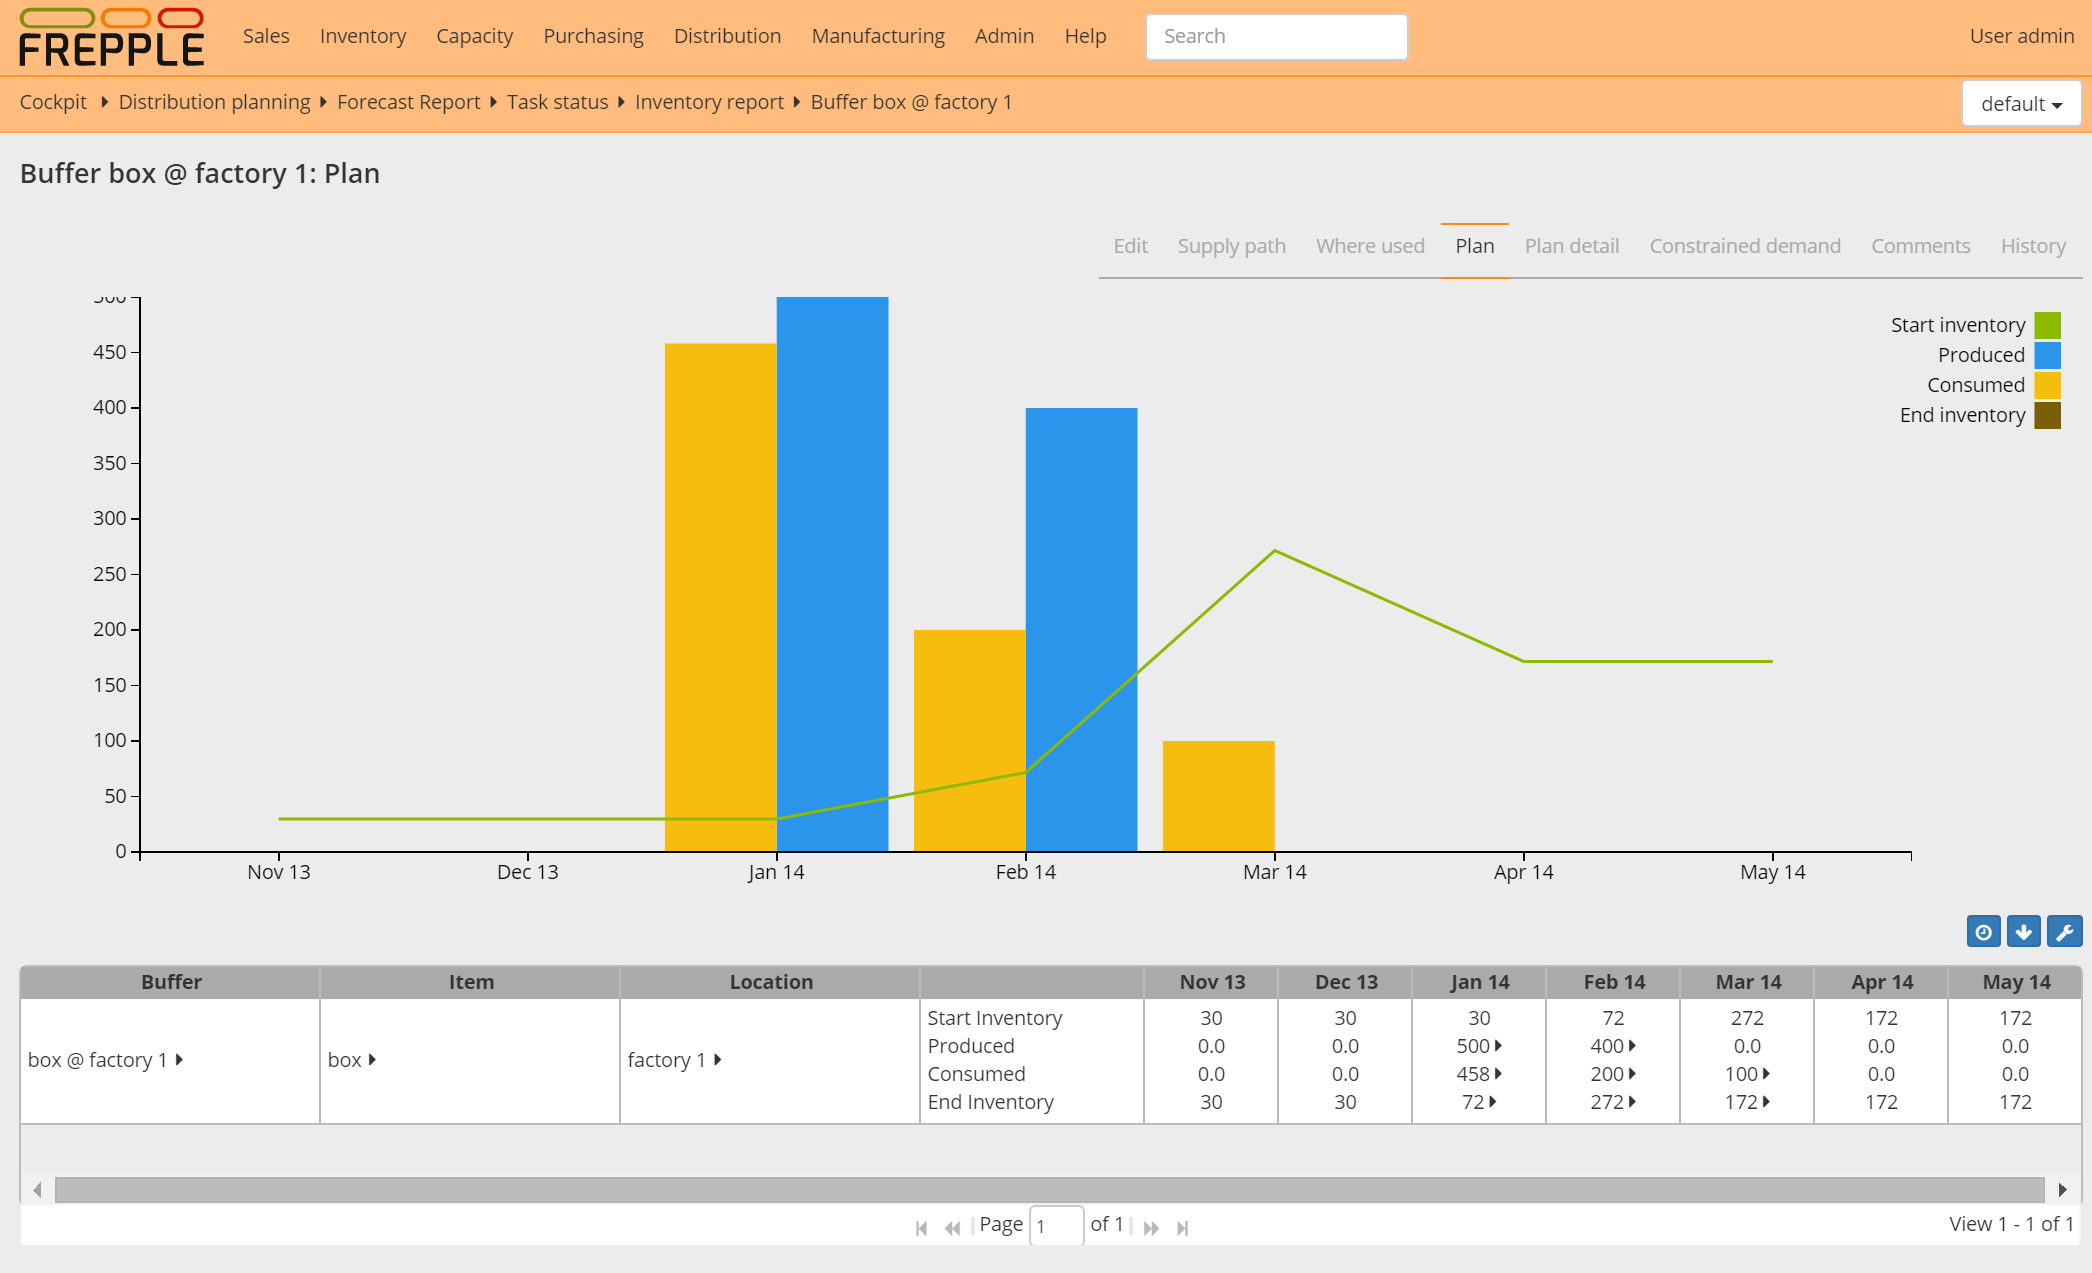
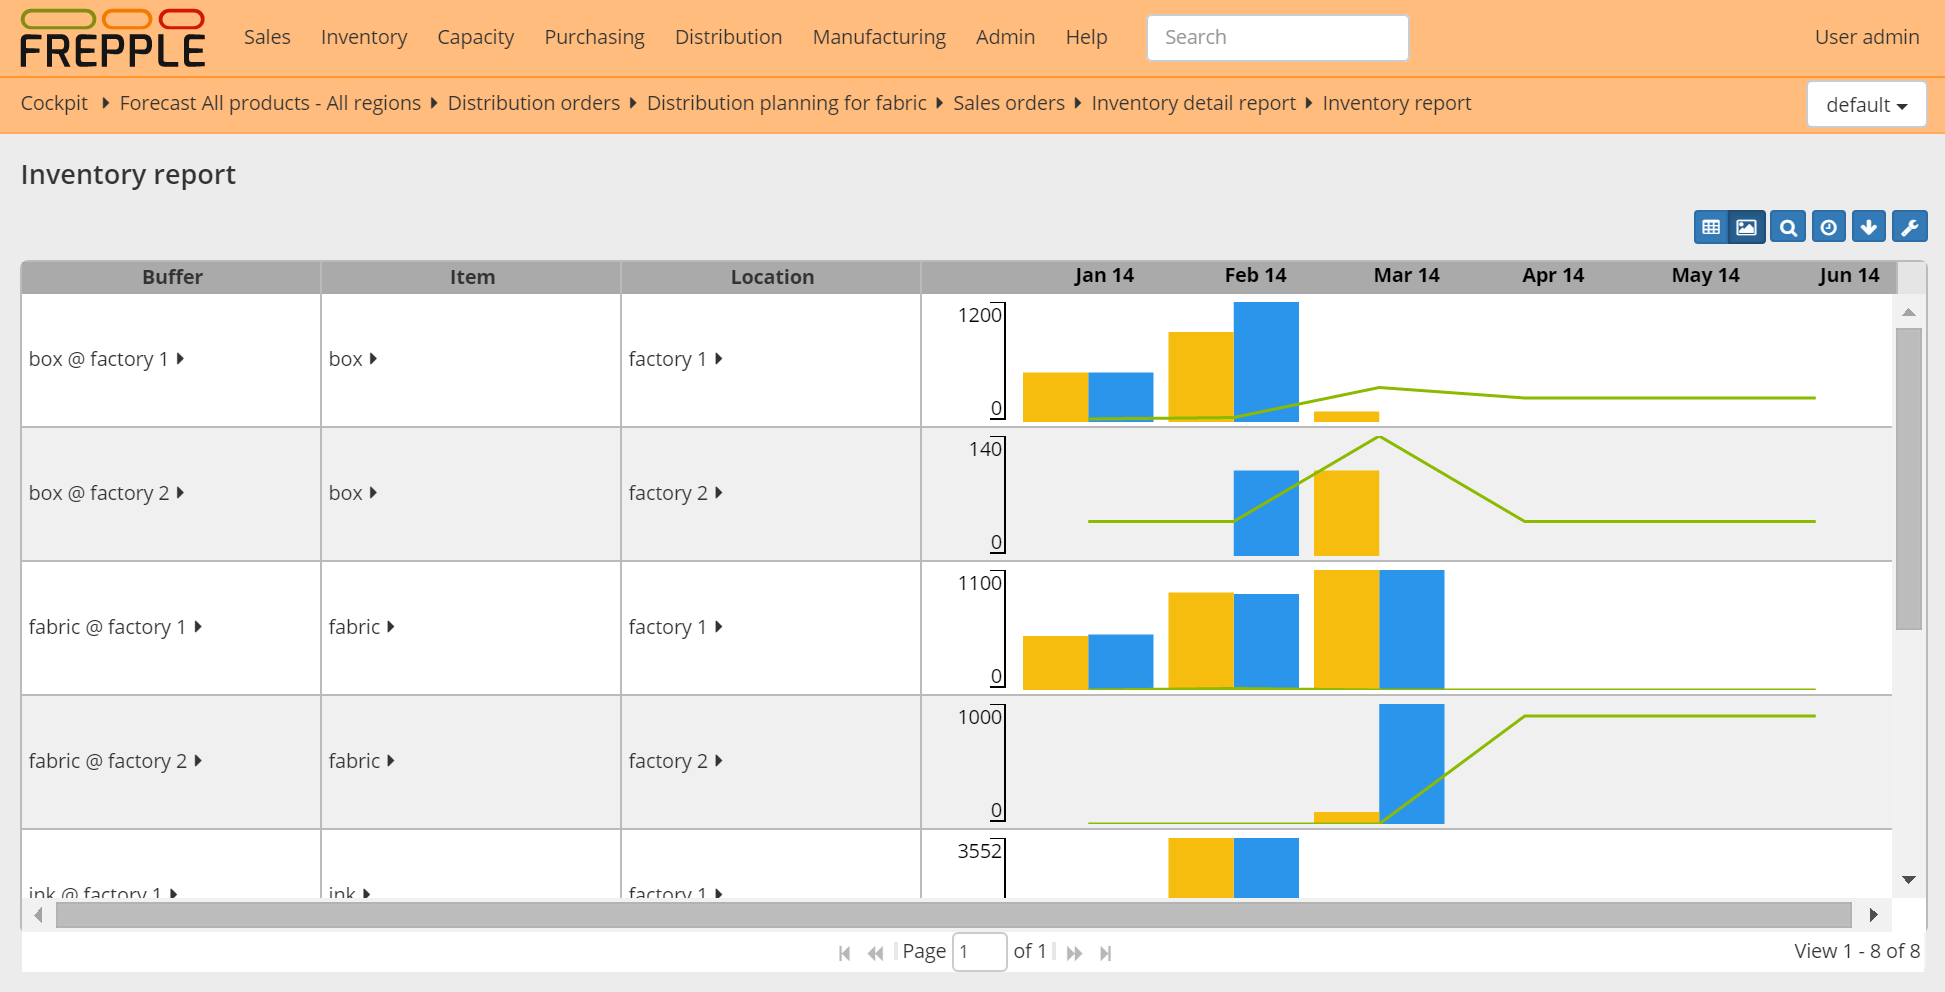
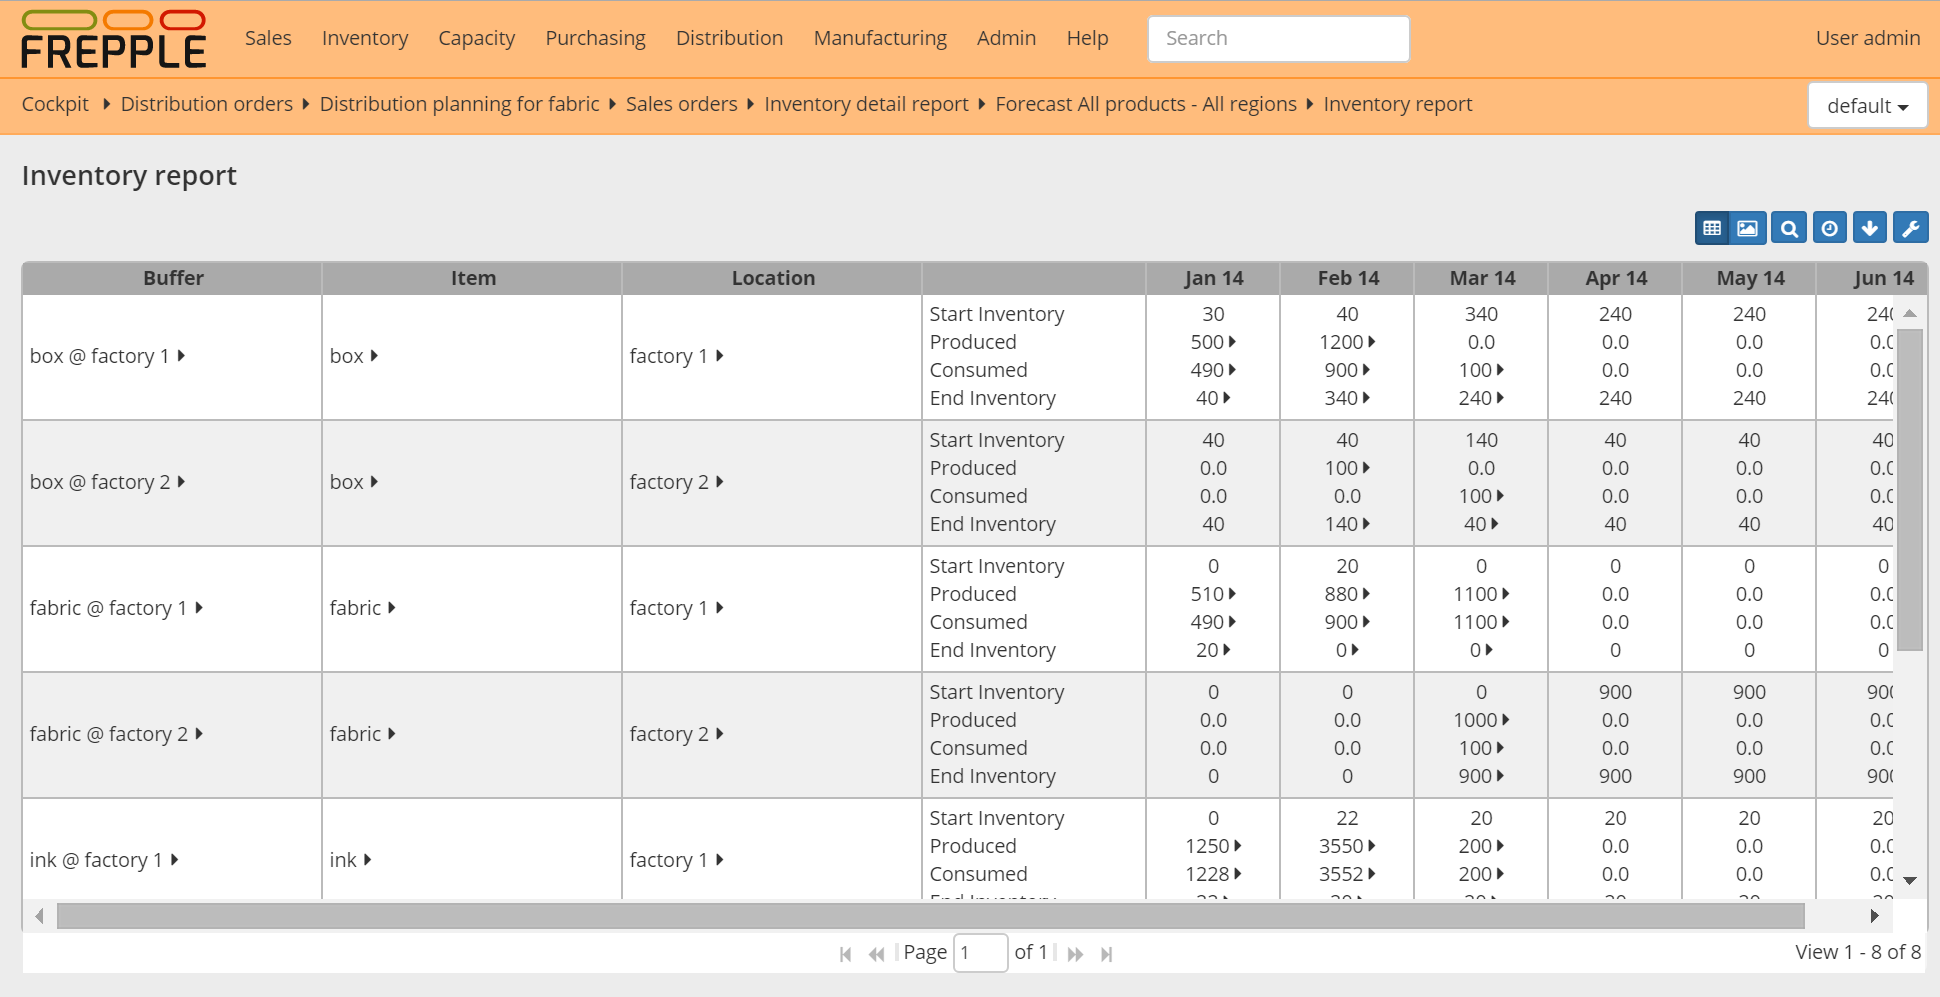
The report shows per buffer and per time bucket the inventory profile: the starting inventory, the material consumed, the material produced and the ending inventory.
If the report is opened for a single buffer an inventory graph is displayed.
Field |
Description |
|---|---|
Item |
Item stored in the buffer. |
Location |
Location of the buffer. |
Start inventory |
Inventory in the buffer at the start of the time bucket. |
Start inventory days of cover |
Shows how many days of demand is covered with the starting inventory.
In other words, it shows when will you run out of stock without new
replenishments.
|
Safety stock |
The safety stock at the start of the time bucket. |
Total produced |
Quantity replenished into the buffer during the time bucket.
A drill down menu is available to see the detail of the supplying operations,
and to see the demands the produced material is used for.
|
Produced by MO |
Displays the quantity replenished by manufacturing orders. |
Produced by PO |
Displays the quantity replenished by purchase orders. |
Produced by DO |
Displays the quantity replenished by distribution orders. |
Total consumed |
Quantity consumed into the buffer during the time bucket.
A drill down menu is available to see the detail of the consuming operations,
and to see the demands the consumed material is used for.
|
Consumed by MO |
Displays the quantity consumed by manufacturing orders. |
Consumed by DO |
Displays the quantity consumed by distribution orders. |
Consumed by SO |
Displays the quantity consumed by sales orders. |
End inventory |
Inventory in the buffer at the end of the time bucket.
A drill down menu is available to see the detail of the consuming and
producing operations, and to see the demands the consumed material is used
for.
|