Plan editor

Important

This report is only available in the Enterprise Edition.

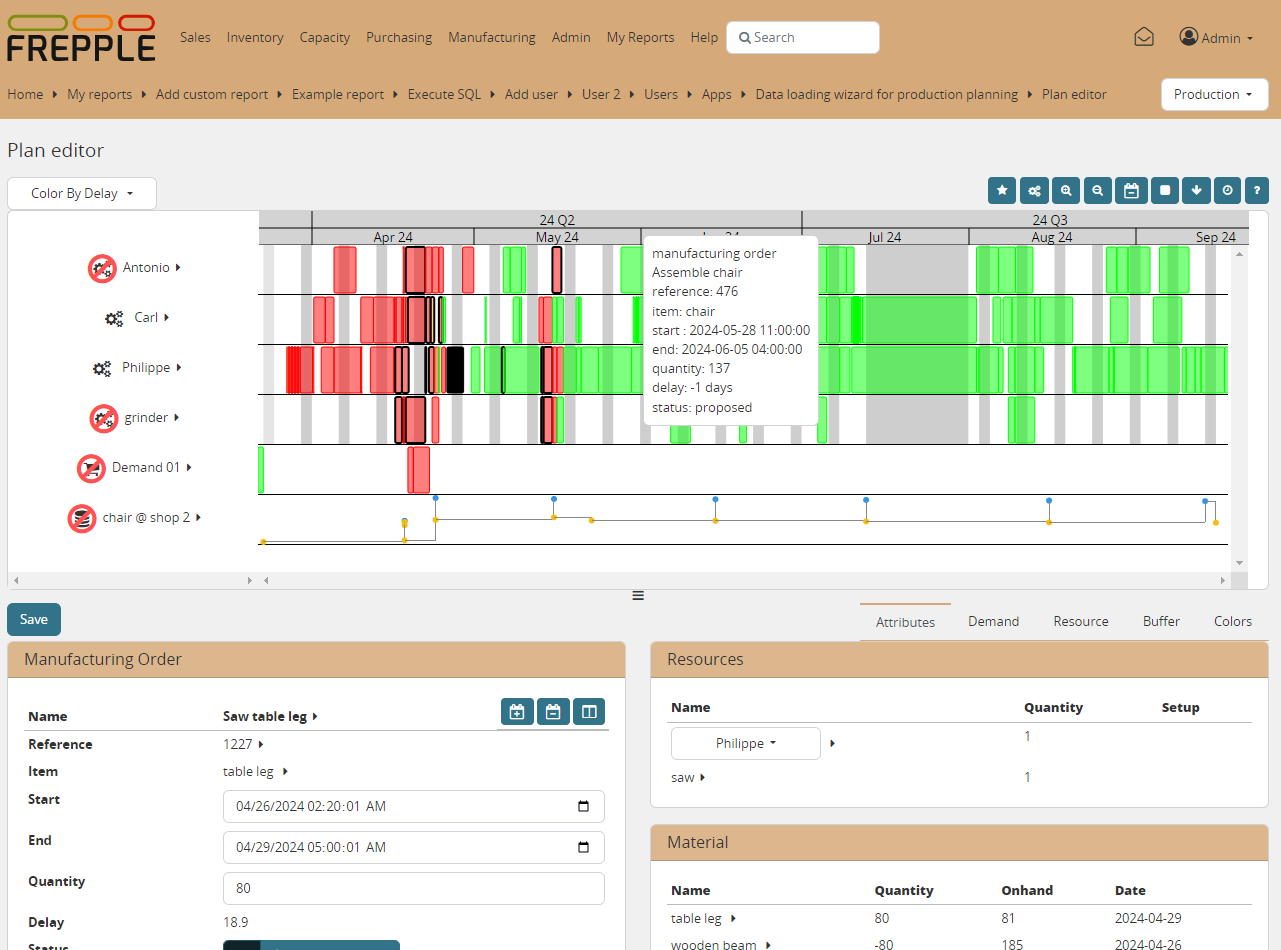
The plan editor report provides an interactive Gantt chart where the user can visually review the plan and make changes to it.

Interactive Gantt chart report

Customizing the layout

The gantt chart visualizes the plan for resource, sales orders or inventory of an item.

Every user can personalize the report to show those entities he/she is interested in. Use the lists at the bottom of the screen to search for entities, and click on the plus icon to add them to the chart.

Also the time scale of the report can be adjusted. Use the clock icon in the upper right to adjust the horizon. You can zoom in with the looking glass icons.

Interactive changes to the plan

The report supports a number of ways to interactively change the plan:

  • You can move a manufacturing order to a new date. You can drag and drop them in the graph, or manually type in the new date of a selected manufacturing order.

  • You can edit quantity, dates and status of a selected manufacturing order in the bottom section of the screen.

  • You can assign the manufacturing order to an alternate resource or an alternate resource. Drag and drop a selected operation to a different row in the graph (possible alternate rows can easily be identified by the icon at the front of the row), or use the dropdown lists in the bottom of the screen.

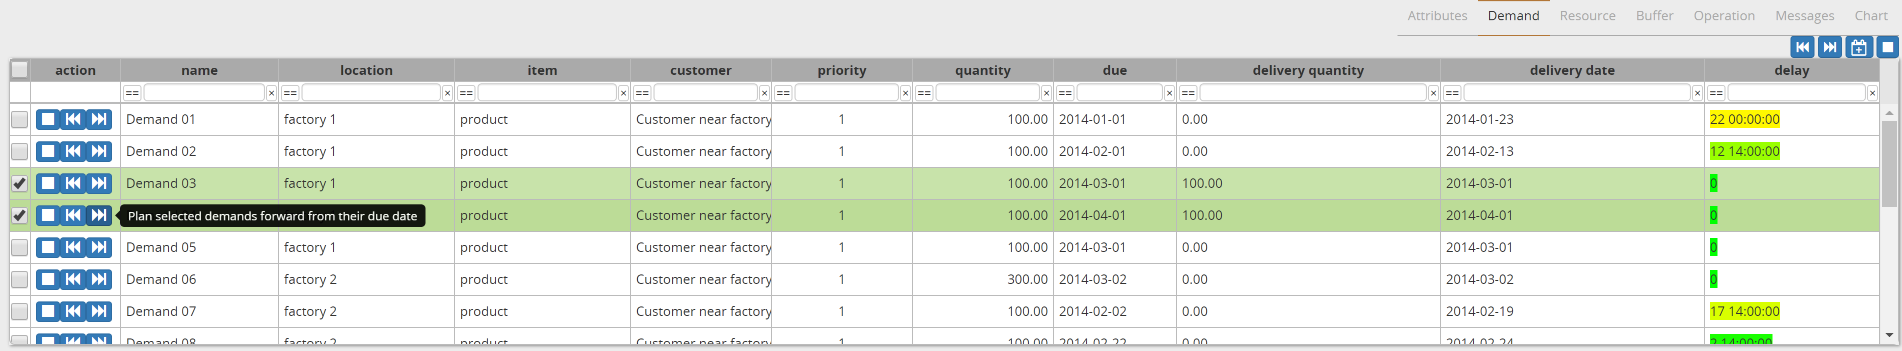
  • You can interactively replan sales orders.

    • The square icon unplans one or more sales order.
      All plans associateded with the selected sales orders are removed from the plan. Only manufacturing orders in the ‘proposed’ status can be removed.
    • The back arrow icon plans one or more sales orders in backward planning mode.
      This means that we search to plan the demand for a delivery as close as possible to its due date.
    • The forward arrow icon plans one or more sales orders in forward planning mode.
      This means that we plan for an ASAP delivery of the order, starting all purchasing and production immediately.
    Replanning demands

Visualization color schemes

The plan can visualized in different ways. Use the dropdown in the upper left corner to change the color method.

  • Color by feasibility
    This is the default color. It highlights manufacturing orders that are not feasible due to capacity overloads, material shortages or lead time constraints.
  • Color by criticality
    A manufacturing order is considered critical if it is on the critical path of one or more demands. Any delay on a critical manufacturing order will result in a late delivery to a customer. It will show up as red.
    When additional “slack time” is available in the plan the manufacturing order is less sensitive to plan disturbances. It is less critical and will shown in yellow to green.
  • Color by delay
    A manufacturing order is considered delayed if it ends later than required to meet the demand on time. This delay also considers the processing time at the following manufacturing steps.
    Delay and criticality are related metrics, but still distinct. For instance, if all manufacturing order for a demand are planned in a just-in-time sequence without gaps they will be considered critical, ie red by the criticality criterion. The manufacturing order still deliver the demand on time so they will show up as on time, ie gree by the delay citerion.
  • Color by due date
    Demands in different weeks get a different color. This makes it easy where the production is anticipated or delayed compared to the demand bucket.
  • Color by priority
    This feature visualizes the plan by the priority of the sales orders they are allocated to. We can easily see which manufacturing orders are associated with high priority demand.
  • Color by inventory status
    The color is an indication of the urgency to replenish the inventory.
    When the inventory of an item is dropping below the safety stock its color will gradually change from yellow (ie just below the safety stock) to red (ie a complete stockout).
    When then inventory of an item is above the safety stock the color is green.
  • Color by item category
    The color of a manufacturing order is determined by the category of the item it produces. The category is supplied by the user in the item.category field.
    The plan editor allows to choose a color for different categories, plus a default color.
  • Color by item subcategory
    See above, but now based on the item.subcategory field.
  • Color by operation category
    See above, but now based on the operation.category field.
  • Color by operation subcategory
    See above, but now based on the operation.subcategory field.
Configuring Gantt chart colors Configuring Gantt chart colors

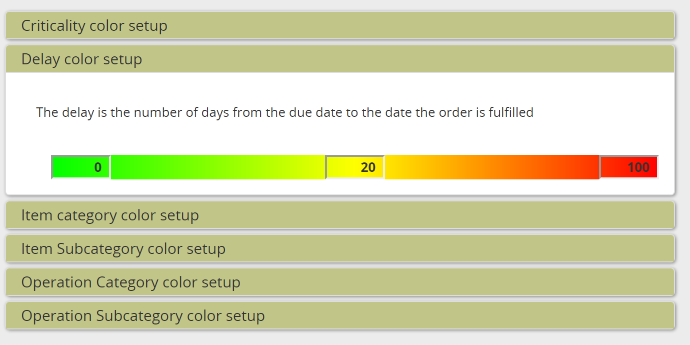
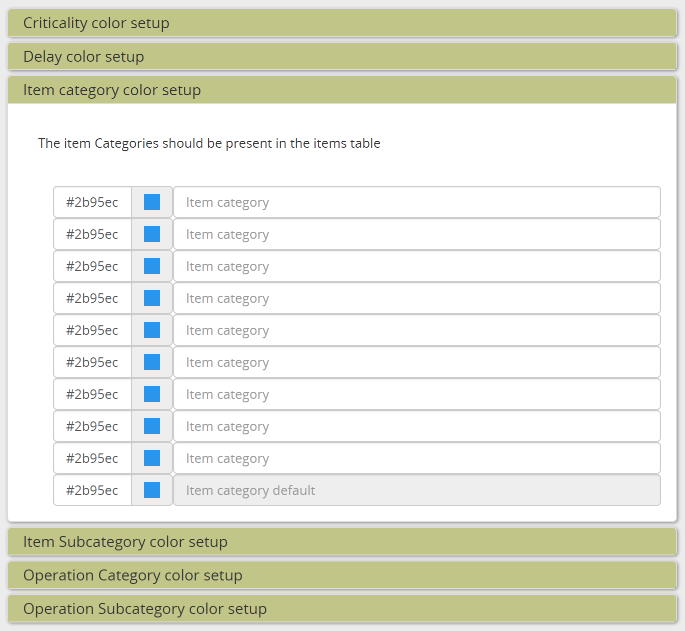
The color configuration is automatically saved when a user with superuser privileges changes them. To assure that all users apply the same color conventions, the settings are shared.