

Forecasting with missing data and stockouts
The sales history we use to compute a statistical may have missing or unreliable data which we need to account for.
A typical use case is an item that has a stockout. The item isn’t available
on the shelf of your store for some time, and sales during that period will
obviously be zero.
The absence of any sales however doesn’t mean there is no customer demand for
this item. We want to avoid that the zero-demand periods incorrectly pull down
the statistical forecast.
Check this feature on a live example
Download an Excel spreadsheet with the data for this example
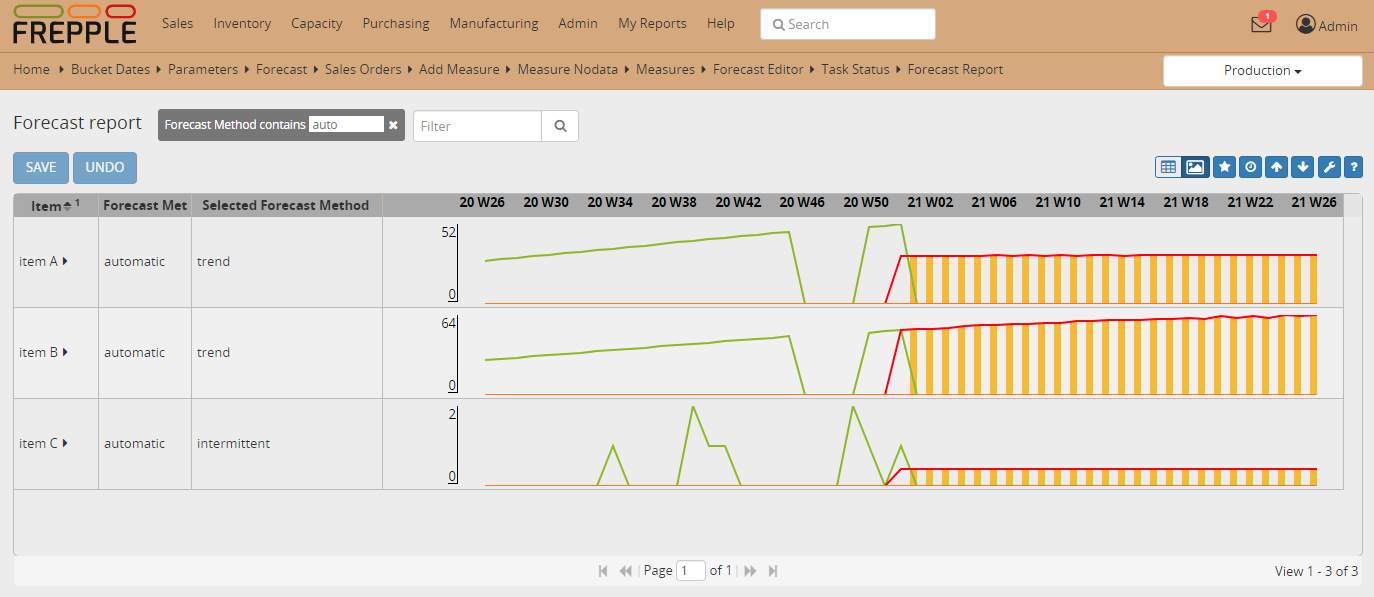
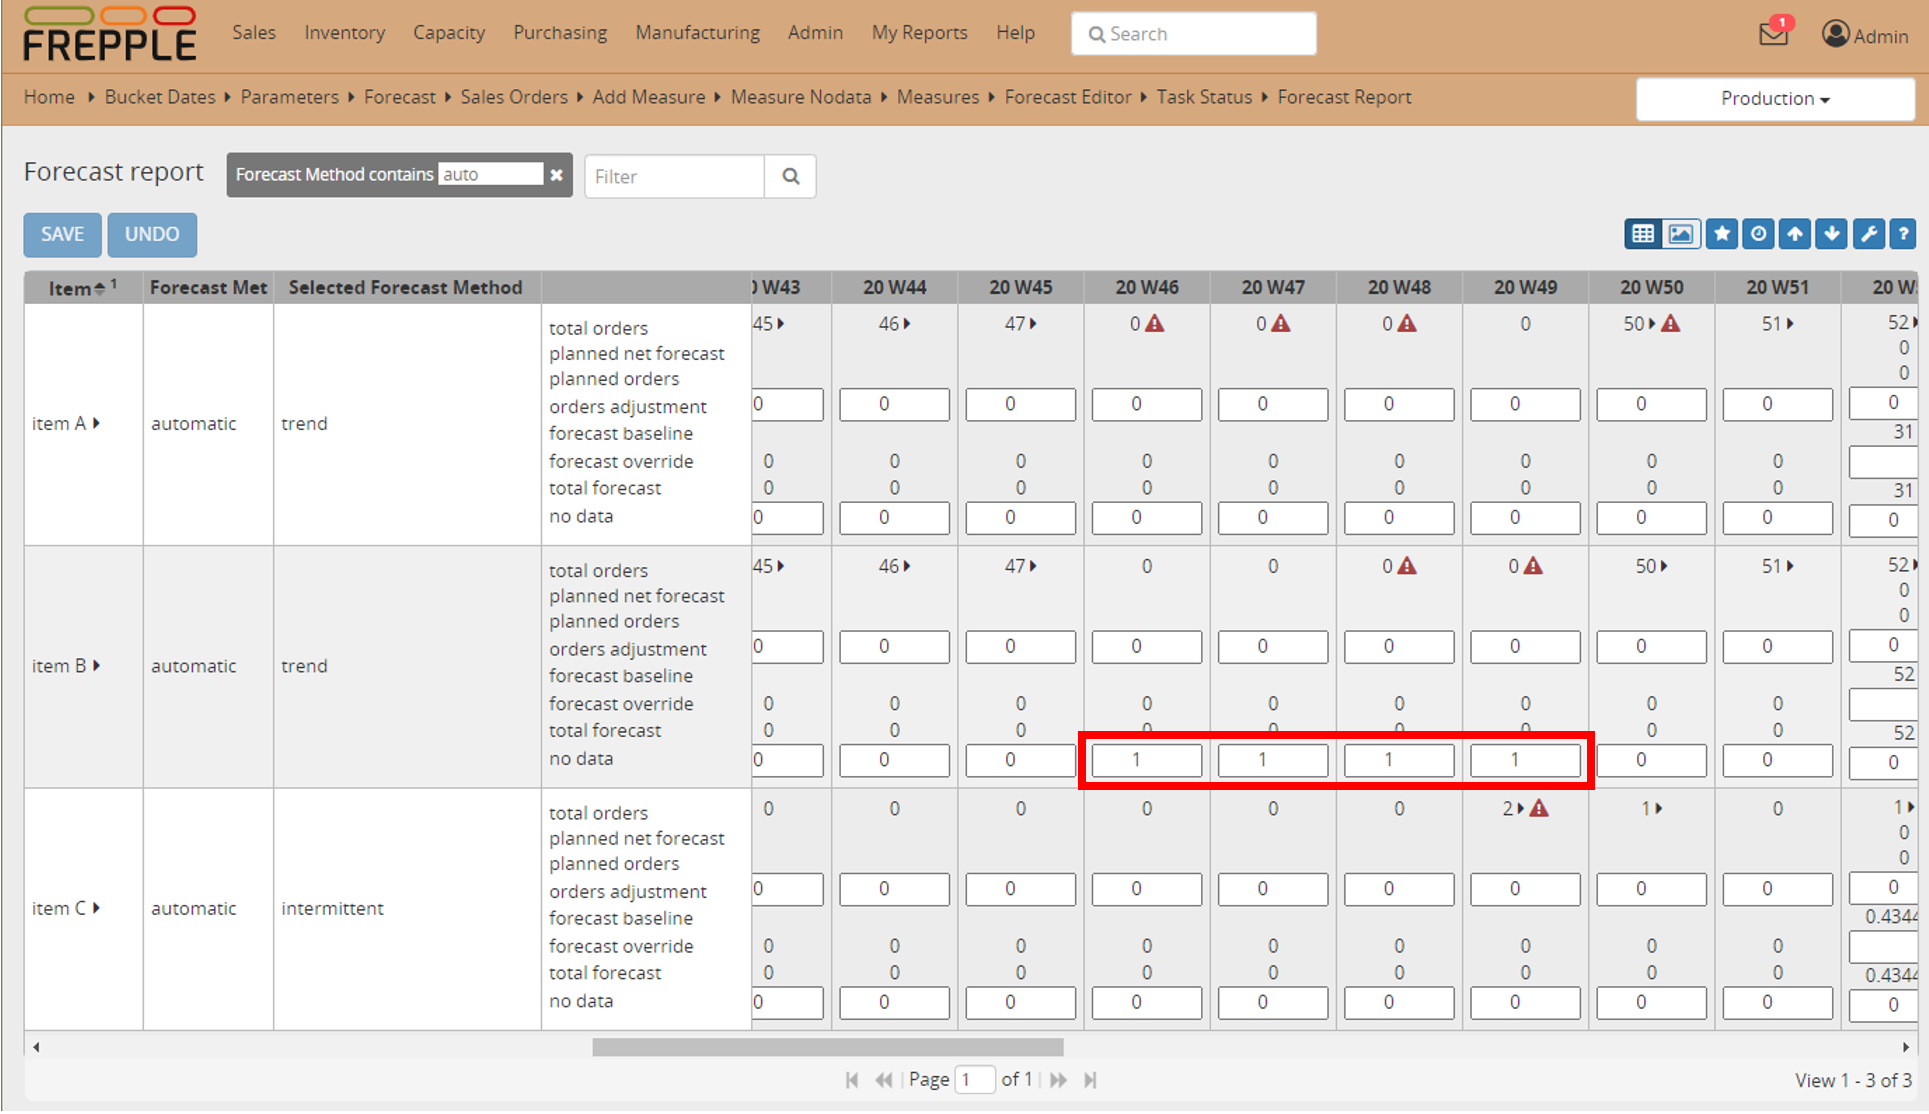
- This example shows 2 items with an identical sales history. A period without demand is obvious on the graph.On item A we have run the standard statistical forecast out-of-the-box.On item B we have marked the periods with a stockout as no-data points.
- The item A without any special correction show a significant decrease in the statistical forecast.The periods without sales have skewed the forecast calculation (and potentially also the selection of the best forecast method).
- The item B has the periods without sales marked explicitly as no-data periods.The forecast algorithm will internally guess the sales for those periods, and as a result the forecast calculation is no longer distorted.
- The third item C also has periods without demand in its history.However, this is a slow moving item and a period without sales is not exceptional for this item. It would not be correct to mark these as no-data points.