Performance indicator report
This report shows some key metrics of the generated plan. In this way it allows quick review of the plan quality, comparisons between different plans, and validation of model or parameter changes.
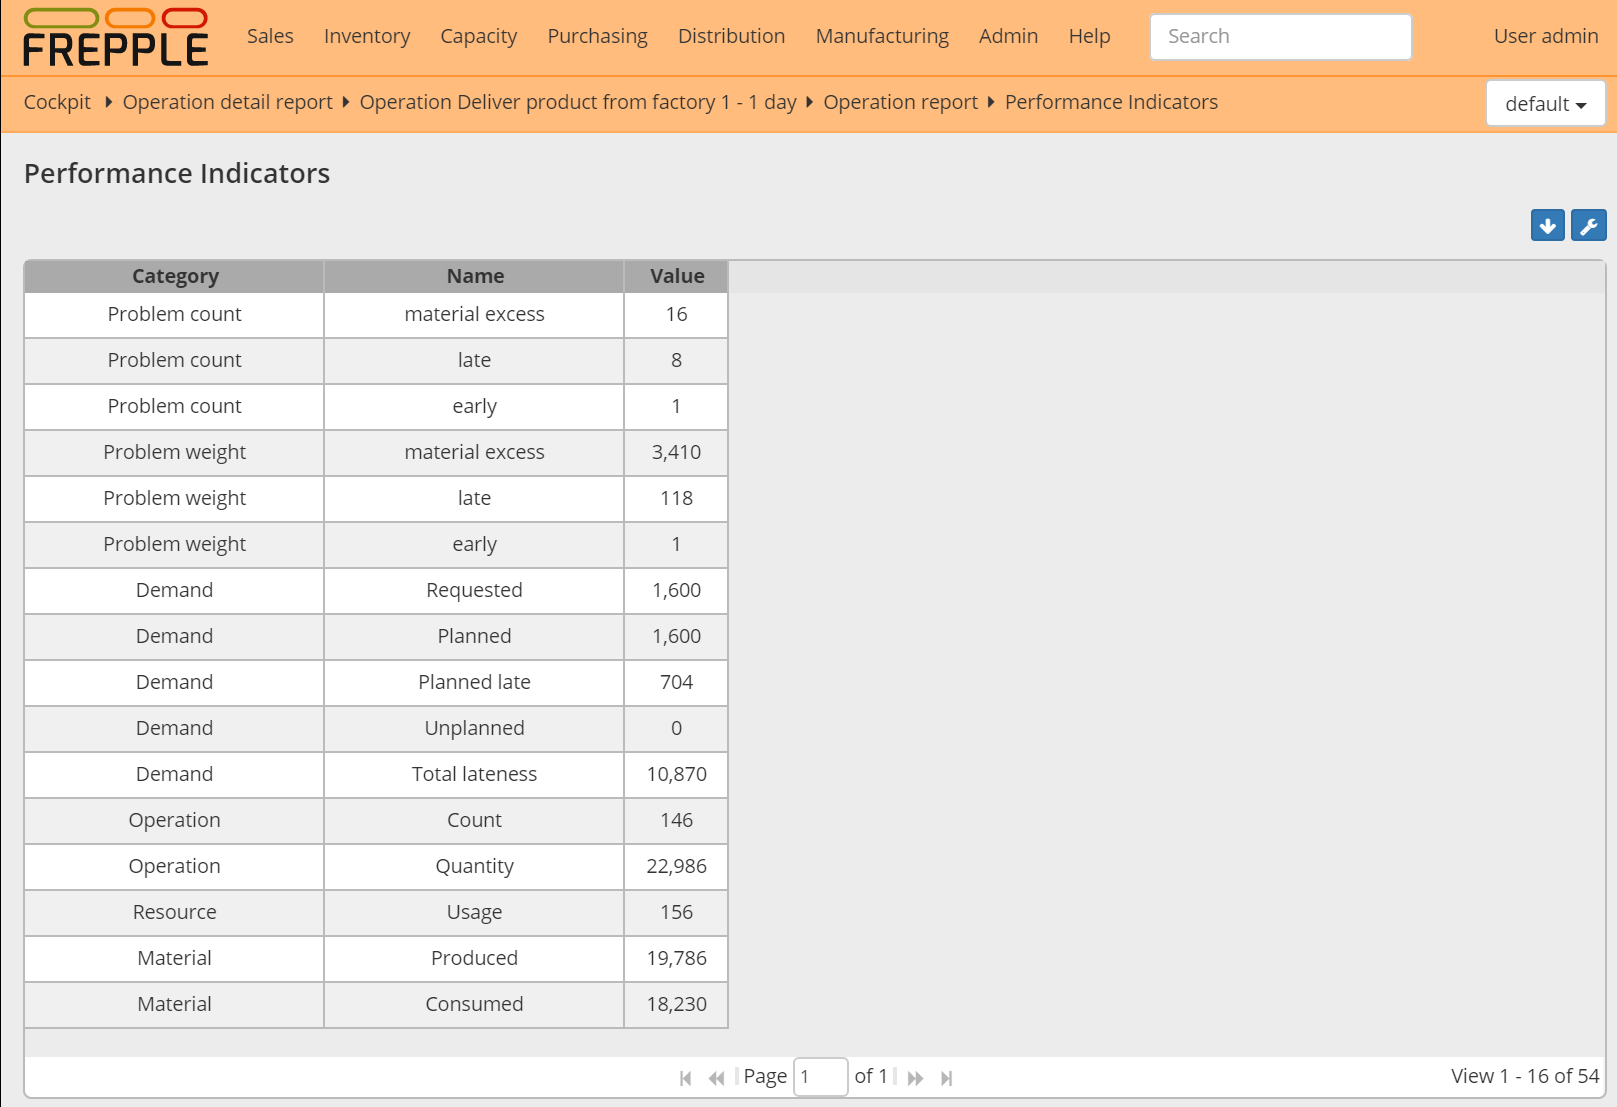
The metrics being reported are:
- ProblemsFor each problem category the total number of problems is reported, as well as the sum of their weights.
- DemandThe total requested quantity of demand (including both net forecast and customer orders) is reported.The total planned quantity is shown, which in absence of any constraints matches the requested quantity. Any difference between the requested and planned quantity is reported as the unplanned quantity.The demand satisfied late is reported both as quantity and in total lateness (being the quantity planned late multiplied by the delay in days).
- OperationThe report displays the total quantity and number of planned operations.
- ResourceThe report displays the total resource consumption. The consumption is defined as the load size * load duration in days.
- MaterialThe total produced and consumed quantities (including raw material, finished goods as well as intermediate buffers) is displayed. When the produced quantity exceeds the consumed quantity the inventory is increasing over the planning horizon.
Caution
It is important to note that these KPIs provide only a high level and very rough indication on the plan. They are in no way intended to be used for reporting the plan results to management. For instance, the metrics assign the same importance to a delay of a high priority customer and a low priority forecast, the numbers give equal weight to inventory of a 1$ component and a 1000$ end item, etc.
Related permissions |
|---|
Can view kpi report |