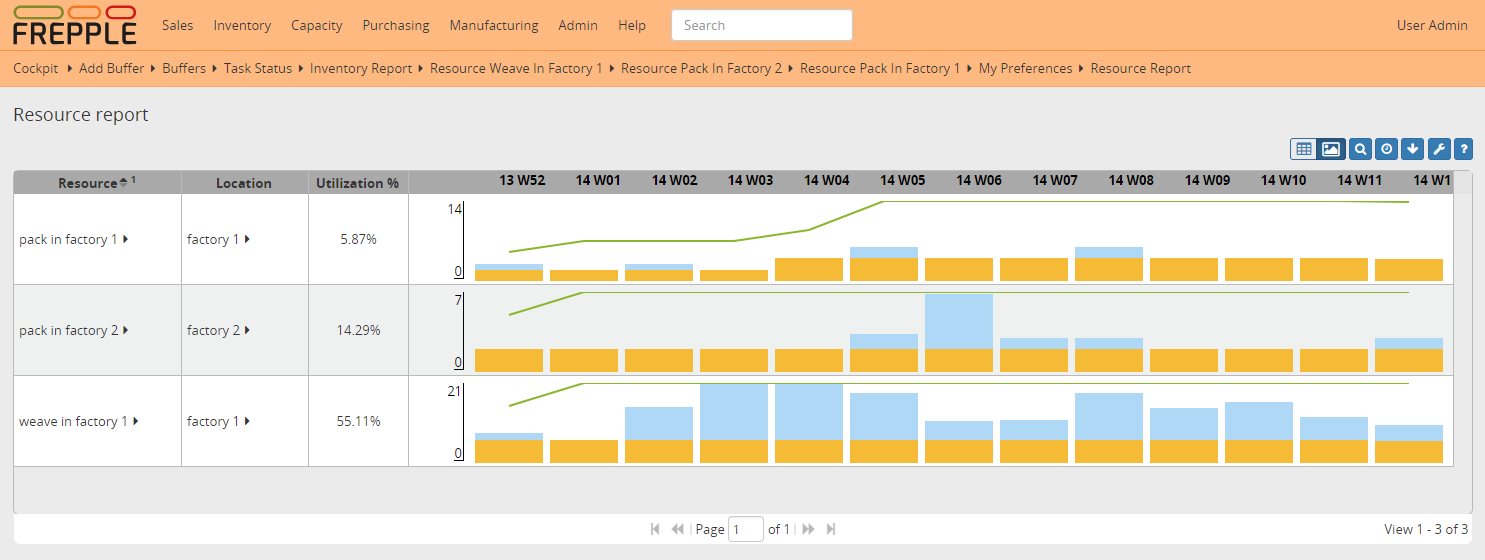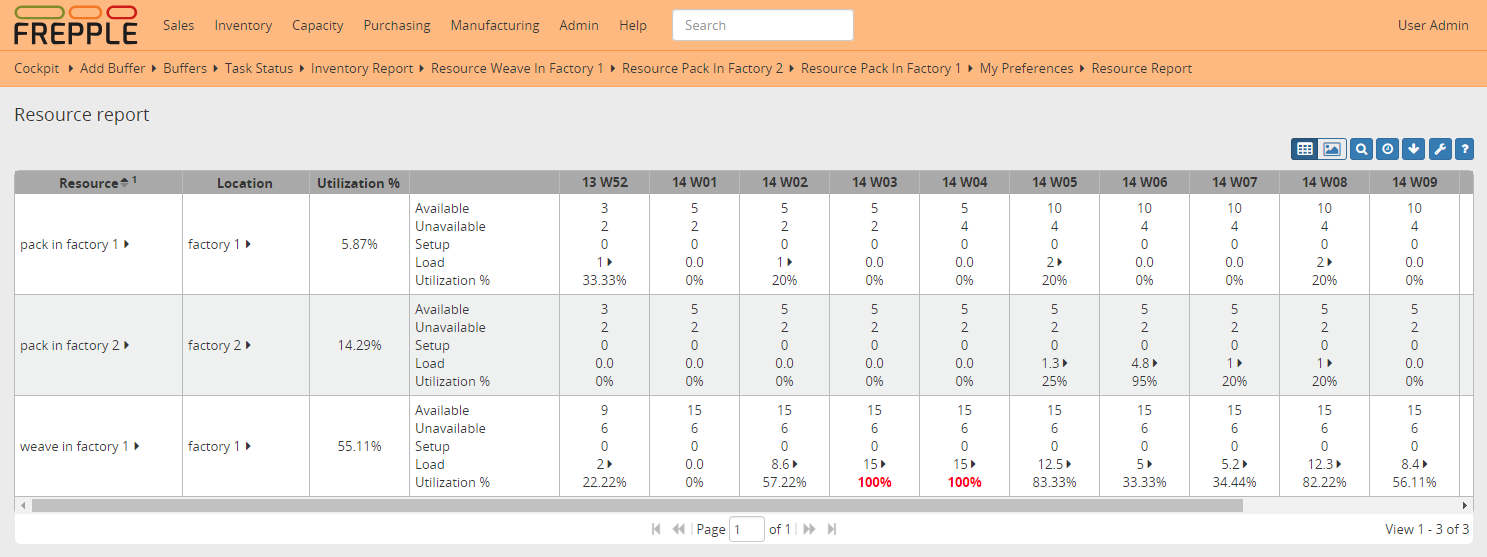
Resource report
This report shows the loading of the resources.
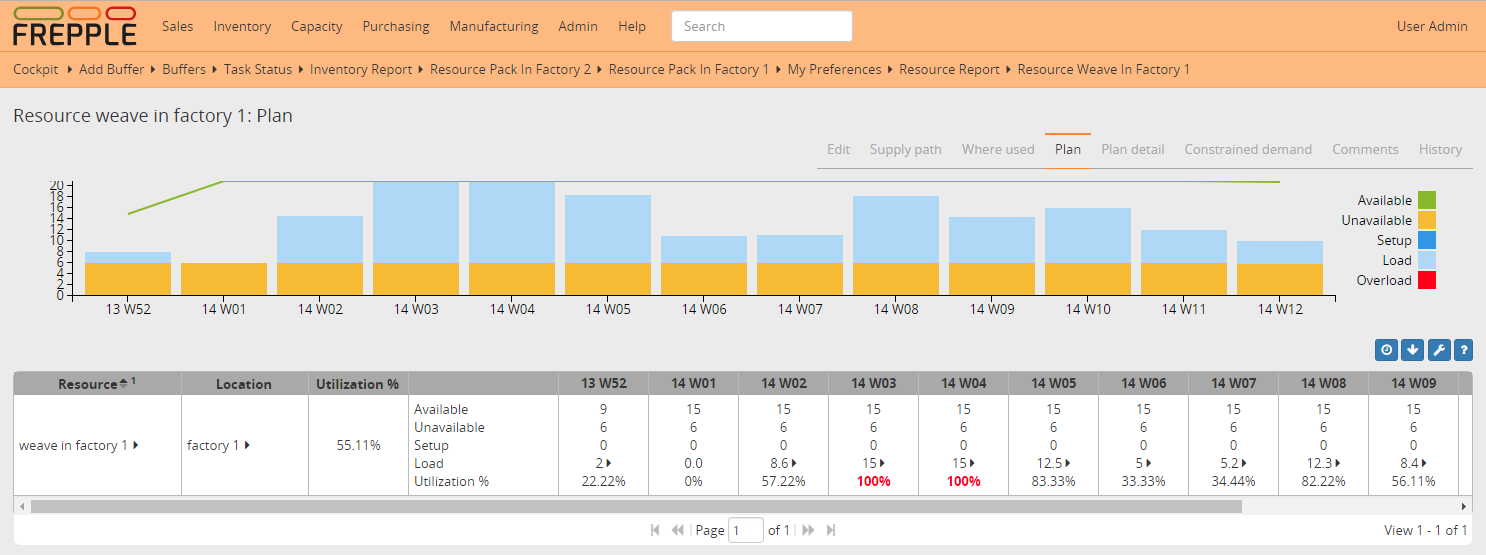
If the report is opened for a single resource a load graph is displayed.
The report shows the plan result in size*time. E.g. a resource has size 1 and we are looking at a weekly bucket: available = 7 E.g. a resource has size 3 and we are looking at a weekly bucket: available = 21 The parameter loading_time_units defines the time units. Acceptable values are hours, days and weeks.
Field |
Description |
|---|---|
Resource |
Resource name. |
Location |
Location of the resource. |
Available |
Total availability on the resource. |
Unavailable |
Unavailable time, as defined in the availability calendar of the resource’s location. |
Setup |
Time spent in conversions between setups. |
Load |
Time spent on actual manufacturing orders. |
Utilization |
Equal to the load divided by the available time, expressed as percentage.
The utilization % just right before the graph is the average utilization
over the complete reporting horizon. The value for each bucket in that
horizon is show in the cells on the right.
|
Related permissions |
|---|
Can view resource report |